
FIGURE
Figure 5
- ID
- ZDB-FIG-211029-199
- Publication
- Heinkele et al., 2021 - Metabolic and Transcriptional Adaptations Improve Physical Performance of Zebrafish
- Other Figures
- All Figure Page
- Back to All Figure Page
Figure 5
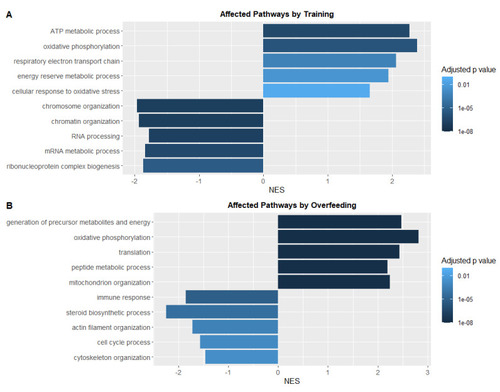
Pathway-Analysis of RNA-Sequencing data in livers showed patterns distinguishing training and overfeeding groups from controls. ( |
Expression Data
Expression Detail
Antibody Labeling
Phenotype Data
Phenotype Detail
Acknowledgments
This image is the copyrighted work of the attributed author or publisher, and
ZFIN has permission only to display this image to its users.
Additional permissions should be obtained from the applicable author or publisher of the image.
Full text @ Antioxidants (Basel)