
- Title
-
Metabolic and Transcriptional Adaptations Improve Physical Performance of Zebrafish
- Authors
- Heinkele, F.J., Lou, B., Erben, V., Bennewitz, K., Poschet, G., Sticht, C., Kroll, J.
- Source
- Full text @ Antioxidants (Basel)
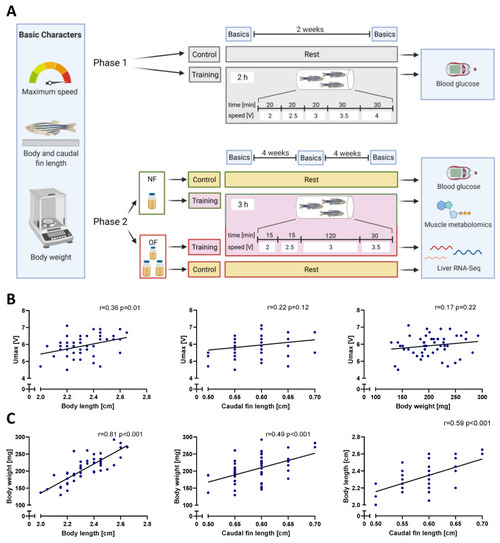
Experiment setup and initial basic character correlations. (A): The experiment was split into two phases. Phase 1: 2-week training; Phase 2: 8-week training including overfeeding. Training protocols differed in current velocity and total duration. Upon completion of the phases, fish were sacrificed, blood glucose was measured, and in phase 2 experiment metabolomics and RNA-Seq data were determined. NF: normal feeding, OF: overfeeding. (B): positive training-independent correlations of body length, caudal fin length and body weight with the maximum speed (Umax). (C): Positive correlations between zebrafish body length, body weight and caudal fin length. Simple linear regression lines were fitted. N = 50 fish per correlation analysis, r: Pearson correlation coefficient, p: two-tailed p value. |
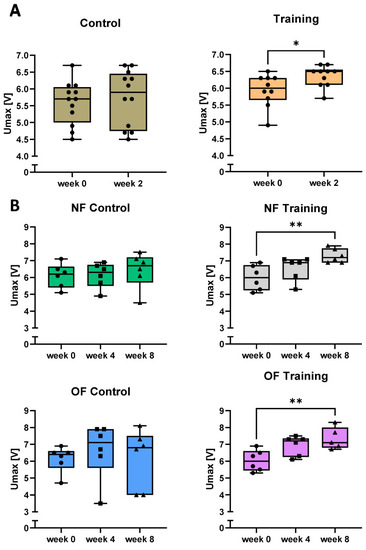
Swim tunnel training improved zebrafish swimming capability. (A): phase 1 training increased Umax significantly after 2 weeks of training (p = 0.0323). Control: N = 12 fish, Training: N = 10 fish. Two-tailed unpaired t-test. (B): phase 2 training increased Umax in both NF and OF groups significantly after 8 weeks of training (NF-training p = 0.0037, OF-training p = 0.0012). N = 6 fish per group. One-way ANOVA test or Kruskal-Wallis test. NF: normal feeding; OF: overfeeding; Umax: maximum speed. * p < 0.05, ** p < 0.01. |
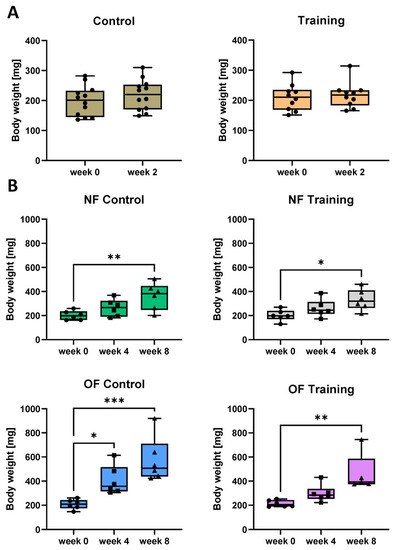
Swim tunnel training prevented weight gain in zebrafish only moderately. (A): phase 1 training did not alter zebrafish body weight. Control: N = 12 fish; Training: N = 10 fish. Two-tailed unpaired t-test. (B): phase 2 training hardly prevented weight gain in normalfed and overfed zebrafish, respectively. Body weight increased after 4 weeks significantly in the OF-control group (p = 0.0461). After 8 weeks, body weight was increased in both the NF and OF-control group (p = 0.0090 and 0.0006, respectively) and in the training groups (p = 0.0161 and 0.0021, respectively). N = 6 fish per group. One-way ANOVA test or Kruskal-Wallis test. NF: normal feeding; OF: overfeeding. * p < 0.05, ** p < 0.01, *** p < 0.001. |
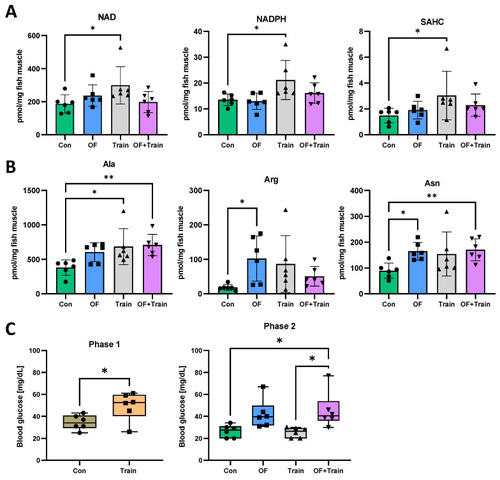
Swim tunnel training significantly altered the metabolome in zebrafish muscle. (A): increased concentrations of adenosine levels in trained zebrafish. NAD: nicotinamide dinucleotide, NADPH: nicotinamide dinucleotide phosphate, SAHC: S-adenosyl-homocysteine. N = 6 fish per group. (B): Alterations on amino acid levels in trained and overfed zebrafish. Ala: Alanine, Arg: Arginine, Asn: Asparagine. N = 6 fish per group. (C): Alterations on fasting blood glucose level. In phase 1 experiment, blood glucose was measured directly after the last training session whereas blood glucose was measured 24 h later in phase 2 experiment. Con: Control; OF: overfeeding; Train: Training. N = 6 fish per group. Statistical tests: Two-tailed unpaired t-test (phase 1) and one way ANOVA test or Kruskal-Wallis test (phase 2). * p < 0.05, ** p < 0.01. |
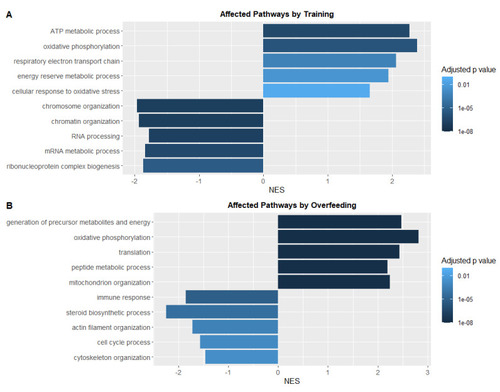
Pathway-Analysis of RNA-Sequencing data in livers showed patterns distinguishing training and overfeeding groups from controls. ( |