
Figure 1
- ID
- ZDB-FIG-211029-195
- Publication
- Heinkele et al., 2021 - Metabolic and Transcriptional Adaptations Improve Physical Performance of Zebrafish
- Other Figures
- All Figure Page
- Back to All Figure Page
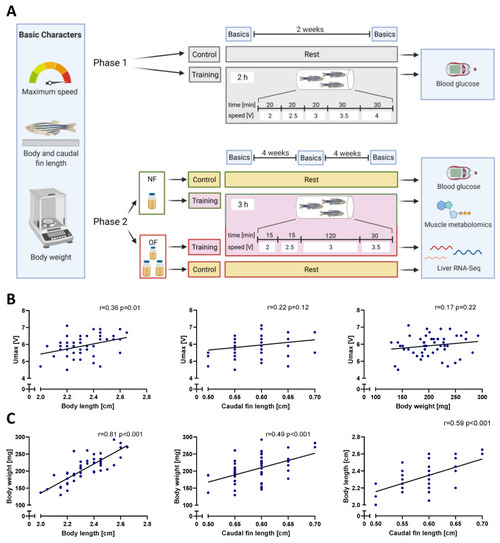
Experiment setup and initial basic character correlations. (A): The experiment was split into two phases. Phase 1: 2-week training; Phase 2: 8-week training including overfeeding. Training protocols differed in current velocity and total duration. Upon completion of the phases, fish were sacrificed, blood glucose was measured, and in phase 2 experiment metabolomics and RNA-Seq data were determined. NF: normal feeding, OF: overfeeding. (B): positive training-independent correlations of body length, caudal fin length and body weight with the maximum speed (Umax). (C): Positive correlations between zebrafish body length, body weight and caudal fin length. Simple linear regression lines were fitted. N = 50 fish per correlation analysis, r: Pearson correlation coefficient, p: two-tailed p value. |