
FIGURE 3
- ID
- ZDB-FIG-211025-142
- Publication
- Jia et al., 2021 - Disruption of Intestinal Homeostasis Through Altered Responses of the Microbial Community, Energy Metabolites, and Immune System in Zebrafish After Chronic Exposure to DEHP
- Other Figures
- All Figure Page
- Back to All Figure Page
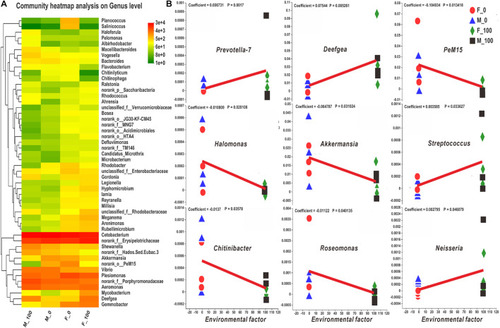
The heatmap and MaAsLin analysis of zebrafish intestinal bacteria according to the level of genus. (A) The bacterial hierarchical genera were clustered by the average manner, and the top 50 genera shown in the map were calculated by the log value of bacterial abundance in each group. (B) In the MaAsLin analysis of top 100 genera, the abundance of Prevotella-7, Deefgea, PeM15, Halomonas, Akkermansia, Streptococcus, Chitinibacter, Roseomonas, and Neisseria genera (B) were significantly related to the environmental factor of DEHP exposure with p < 0.05. In the heatmap, the X and Y axes are groups and genera with the cluster tree on the left, and the scale shown on the right side is the color range of different abundance values. In the MaAsLin legend, the X-axis means the relative abundance of each genus, and Y-axis indicates the environmental factor of DEHP exposure. |