
- Title
-
Disruption of Intestinal Homeostasis Through Altered Responses of the Microbial Community, Energy Metabolites, and Immune System in Zebrafish After Chronic Exposure to DEHP
- Authors
- Jia, P.P., Junaid, M., Xin, G.Y., Wang, Y., Ma, Y.B., Pei, D.S.
- Source
- Full text @ Front Microbiol
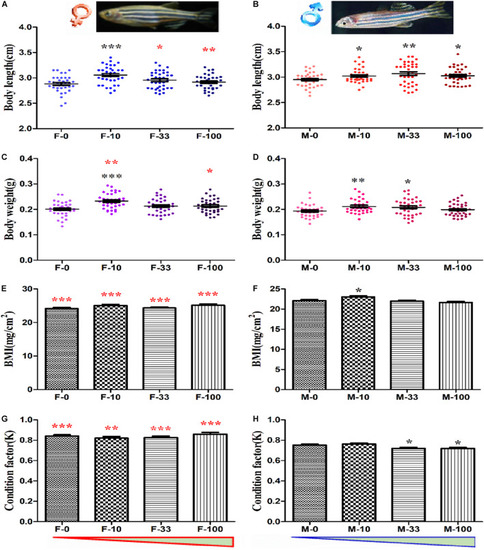
The developmental indexes of zebrafish after long-term DEHP exposure. The body length (cm) of female (A) and male (B) fish, and the body weight (g) of female (C) and male (D) fish were presented. The BMI and condition factor (K) of female (E,G) and male (F,H) fish were calculated. The data were presented as the mean ± standard error (SEM) of (12 pairs recorded/replicate, 3 biological replicates/group, n = 36 female and 36 male) zebrafish in each group. The black symbols *, **, and *** showed p < 0.05, 0.01, and 0.001 with significant differences between exposure and control groups (F-0 vs. F-10, F-0 vs. F-33, F-0 vs. F-100, M-0 vs. M-10, M-0 vs. M-33, and M-0 vs. M-100), and the red symbol *, **, and *** stands for the significances between female and male in the same groups (F-0 vs. M-0, F-10 vs. M-10, F-33 vs. M-33, and F-100 vs. M-100). The red and blue triangles are represented for the concentration trend of DEHP exposure in female and male groups. |
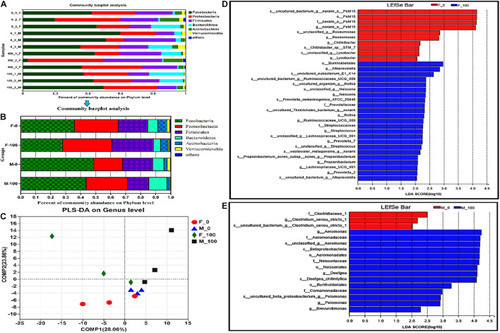
The analysis of zebrafish intestinal microbiota community at levels from phylum to species. The composition of intestinal microbiota at the phylum level (distribution in all samples A and averaged in groups B), and PLS-DA analysis (C) in zebrafish after DEHP exposure, and the average value of three replicates (n = 3) for female and male samples in each group was calculated, and the value of phylogenetic groups accounting for < 0.01 was summarized as “others.” The LEfSe analysis of intestinal microbiota showed the major affected bacteria in female (D) and male (E) zebrafish from phylum to species level, with the LDA value >2 and all-against-all (stricter) strategy. |
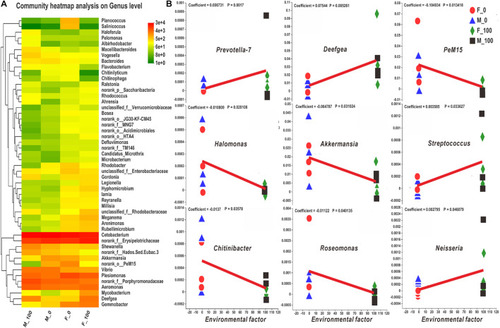
The heatmap and MaAsLin analysis of zebrafish intestinal bacteria according to the level of genus. (A) The bacterial hierarchical genera were clustered by the average manner, and the top 50 genera shown in the map were calculated by the log value of bacterial abundance in each group. (B) In the MaAsLin analysis of top 100 genera, the abundance of Prevotella-7, Deefgea, PeM15, Halomonas, Akkermansia, Streptococcus, Chitinibacter, Roseomonas, and Neisseria genera (B) were significantly related to the environmental factor of DEHP exposure with p < 0.05. In the heatmap, the X and Y axes are groups and genera with the cluster tree on the left, and the scale shown on the right side is the color range of different abundance values. In the MaAsLin legend, the X-axis means the relative abundance of each genus, and Y-axis indicates the environmental factor of DEHP exposure. |

The histomorphological analysis of zebrafish intestine tissues with H&E stain. The histological analysis of gut tissue in female (A) and male (C) zebrafish in the control group, female (B) and male (D) zebrafish in 100 μg/L DEHP treatment group. According to the gut tissue indexes (E), the height (F) and width (G) of villi, and muscular thickness (H) were measured from sections with 200 μm scale bar and 200 × images. And the symbol black * indicated p < 0.05 as the significant changes compared to control, the red * stands for the p < 0.05 as the significant changes of F-0 vs M-0. |
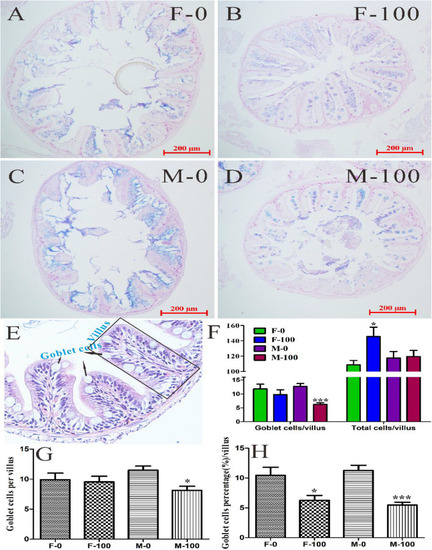
The goblet cells in zebrafish intestine tissues with AB-PAS and H&E stain. The histological analysis of gut tissue in female (A) and male (C) zebrafish in the control group, female (B) and male (D) zebrafish in the 100 μg/L DEHP treatment group. From the H&E sections of gut tissues (E), the goblet cells and total cells of each villus (F) were counted. (G) The number of goblet cells was counted from AB-PAS sections with 200 μm scale bar and 200× images, and (H) the percentages of goblet cells per villus were calculated by comparing total cells in the corresponding villus. There was no difference between females and males in the same group, and the symbol * and *** indicated p < 0.05 and 0.001 as the significant changes compared to control. |
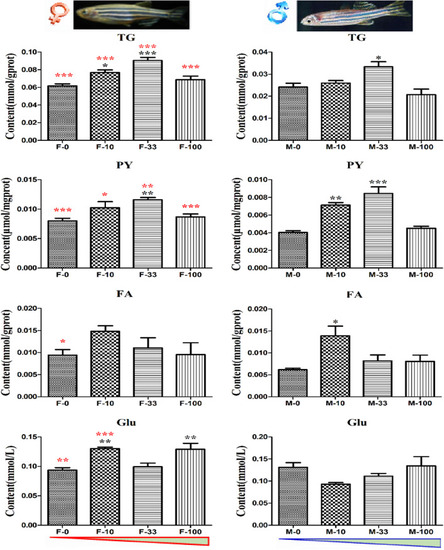
The energy metabolites in DEHP exposed zebrafish intestines. The contents of metabolites TG, PY, FA, and Glu related to the energy cycle in treated zebrafish were measured with three biological replicates per group, and the black symbols *, **, and *** implied p < 0.05, 0.01, and 0.001, respectively. Moreover, the contents in both sex zebrafish were different, and the red color symbols *, **, and *** stand for the significant difference between female and male fish in the same groups. The red and blue triangles mean the increasing DEHP exposure concentration in female and male groups. |
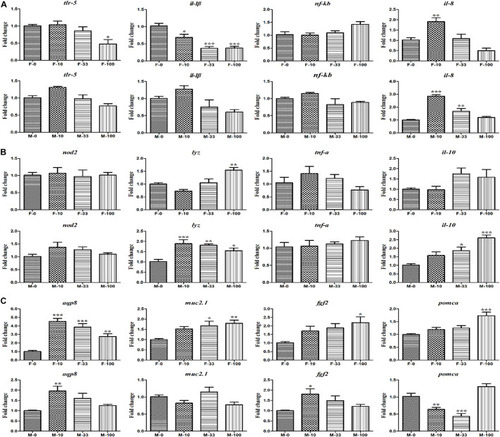
The expression of the intestinal functions-related genes in DEHP exposed zebrafish intestines. (A) The relative expression of tlr-5, il-1β, nf-κb, and il-8 genes involved in the immune response. (B) The expression of nod2, lyz, tnf-α, and il-10 genes related to bacterial handling and antimicrobial defense. (C) The secretory and absorptive, obesity-related genes of aqp8, muc2.1, fgf2, and pomca in female and male zebrafish. Three biological replicates per group were performed and the symbols *, **, *** indicated p < 0.05, 0.01, <0.001 as significant differences between DEHP treatment and control groups. |

Spearman’s correlation coefficients among the abundance of intestinal microbiota, the metabolites, and the expression of intestinal functions-related genes. In the control and DEHP exposed female (A) and male (B) zebrafish, TG, PY, FA, and tlr-5, lyz, il-8, tnf-α, aqp8, fgf2, and pomca were sensitively related to the abundances of Erysipelotrichaceae, Aeromonas, Deefgea, Mycobacterium, Akkermansia, PeM15, and Rhodobacter at the genus level. The red and blue frames indicated a positive and negative correlation, respectively. Spearman’s correlation coefficients and p values were determined by a two-tailed test and the 95% confidence interval. The scale showed the color range of different correlation coefficients among bacteria, metabolic, and gene expression, and the symbols *, ** represented the significance levels at p < 0.05 and p < 0.01. |