
FIGURE 1
- ID
- ZDB-FIG-211025-140
- Publication
- Jia et al., 2021 - Disruption of Intestinal Homeostasis Through Altered Responses of the Microbial Community, Energy Metabolites, and Immune System in Zebrafish After Chronic Exposure to DEHP
- Other Figures
- All Figure Page
- Back to All Figure Page
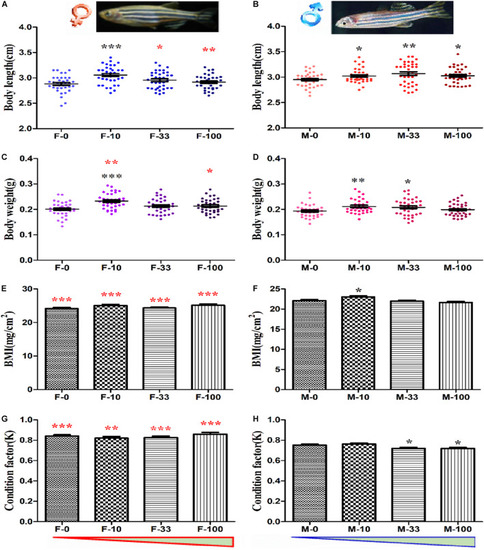
The developmental indexes of zebrafish after long-term DEHP exposure. The body length (cm) of female (A) and male (B) fish, and the body weight (g) of female (C) and male (D) fish were presented. The BMI and condition factor (K) of female (E,G) and male (F,H) fish were calculated. The data were presented as the mean ± standard error (SEM) of (12 pairs recorded/replicate, 3 biological replicates/group, n = 36 female and 36 male) zebrafish in each group. The black symbols *, **, and *** showed p < 0.05, 0.01, and 0.001 with significant differences between exposure and control groups (F-0 vs. F-10, F-0 vs. F-33, F-0 vs. F-100, M-0 vs. M-10, M-0 vs. M-33, and M-0 vs. M-100), and the red symbol *, **, and *** stands for the significances between female and male in the same groups (F-0 vs. M-0, F-10 vs. M-10, F-33 vs. M-33, and F-100 vs. M-100). The red and blue triangles are represented for the concentration trend of DEHP exposure in female and male groups. |