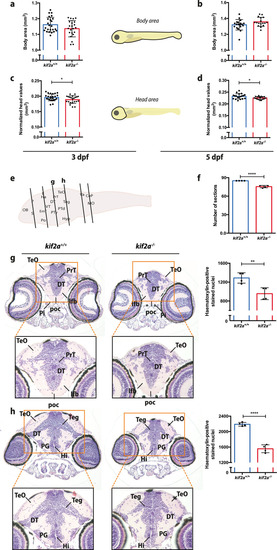
kif2a larvae present microcephaly that is associated with defects in neurologic development. a–d, Comparison of the individual measurements for body area (a, b) and head size (c, d) for kif2a+/+ and kif2a−/− larvae at 3 and 5 dpf. Data are represented as the mean ± SD. Significant values are noted as *p ≤ 0.05. e, Histologic assessment of 5 dpf kif2a−/− and kif2a+/+ larval brains. Six brain regions (from forebrain to hindbrain) were selected per genotype as indicated in the diagram. f, Comparison of the number of brain sections from forebrain to hindbrain (e) between kif2a+/+ and kif2a−/− larvae. Data are represented as the mean ± SD. Significant values are noted as ****p ≤ 0.0001. g, h, Coronal sections stained with H&E imaged at 20× and 40× (indicated by orange square) magnification. DT, Dorsal thalamus; Hi, intermediate hypothalamus; lfb, lateral forebrain bundle; PG, preglomerular complex; PrT, pretectum; Teg, midbrain tegmentum; TeO, tectum opticum. Bar graphs compare hematoxylin-positive stained nuclei between kif2a+/+ and kif2a−/− larvae. Data are represented as the mean ± SD. Significant values are noted as ****p ≤ 0.0001 and **p ≤ 0.01. A significant neuronal loss was observed in specific brain regions of kif2a−/− zebrafish larvae (Extended Data Fig. 5-1).
|
