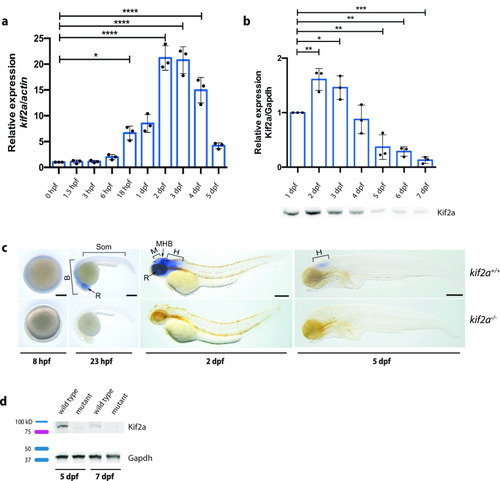
Expression and localization pattern of kif2a in the developing zebrafish. a, qPCR analysis of kif2a levels in kif2a+/+ larvae normalized to actin and represented as the fold change expression to 0 hpf. Values are reported as the mean ± SEM of three separate experiments. Significant values are noted as ****p ≤ 0.0001 and *p ≤ 0.05. b, Relative quantification of Kif2a protein expression in kif2a+/+ larvae of 1–7 dpf normalized to Gapdh and represented as the fold change expression to 1 dpf. Values are reported as the mean ± SEM of three separate experiments. Significant values are noted as ***p ≤ 0.001, **p ≤ 0.01, and *p ≤ 0.05. Below the graph is a representative Western blot image of Kif2a protein expression levels in kif2a+/+ larvae of 1–7 dpf. c, Spatiotemporal expression patterns of kif2a by whole-mount RNA in situ hybridization at 8 hpf, 23 hpf, 2 dpf, and 5 dpf. B, Brain; H, hindbrain; M, midbrain; MBH, midbrain–hindbrain boundary; Som, somite; R, retina. Scale bar, 200 μm. d, Representative Western blot image of Kif2a protein expression levels comparing kif2a+/+ with kif2a−/− larvae at 5 and 7 dpf.
|
