|
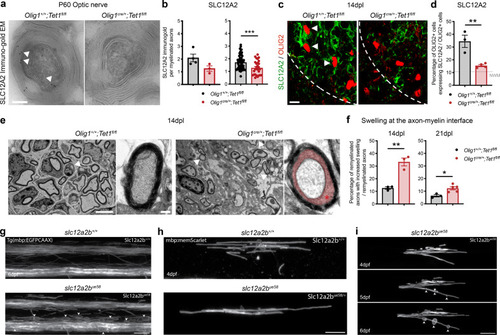
Ablation of <italic>Slc12a2b</italic> in zebrafish induces myelin swellings reminiscent of those detected in old mice.a Ultra-micrograph of immunogold staining for SLC12A2 in P60 Olig1+/+;Tet1fl/fl and Olig1cre/+;Tet1fl/fl optic nerves SLC12A2 immunoreactive particles localized at the axon–myelinic interface in control tissue(white arrowheads). Scale bar = 5 µm. b Quantification of the SLC12A2 particles in optic nerves. Data represent of the average number of SLC12A2 gold particles per mouse (left) and per axon (right). Error bars represent SEM for myelinated axons, quantified in n = 4 control and n = 3 mutant mice (total of at least 27 and at maximum 64 myelinated axons quantified in one replicate) (p = 0.0866, ***p = 0.0008, Student’s t test two-tailed). c Representative confocal image of spinal cord at 14dpl stained for SLC12A2 (green) andOLIG2 + (red), in mice of the indicated genotype. White arrowheads indicate co-labeled cells. Scale bar = 50 μm. d Percentage of OLIG2 + cells expressing SLC12A2 in lesioned spinal cords in mice of the two genotypes, at the 14dpl time point. Dotted line refers to the percentage of OLIG2 + cells expressing SLC12A2 in unlesioned tracts. Error bars represent SEM for n = 3 control mice and n = 4 Tet1 mutants (**p = 0.0059, Student’s t test two-tailed). e Representative electron micrographs of spinal cord sections from wild type and mutants at 14dpl. Low and high magnification (inset) are shown for Olig1+/+;Tet1fl/fl and Olig1cre/+;Tet1fl/fl. Note the swelling of the axomyelinic space in Tet1 mutants (red area and asterisk). Scale bar = 10 µm. f Quantification of the percentage of remyelinated axons with increased swelling in Olig1+/+;Tet1fl/fl and Olig1cre/+;Tet1fl/fl lesions at 14dpl and 21dpl. Data are average counts. Error bars represent SEM for n = 3 control mice and Tet1 mutants at 14dpl, n = 3 control mice and n = 5 Tet1 mutants at 21dpl (**p = 0.0032 at 14dpl, *p = 0.0164 at 21dpl, Student’s t test two-tailed). g Lateral views of the spinal cord in 6dpf Tg(mbp:EGFP-CAAX) zebrafish where myelinating glia in the CNS are labeled. Compared to wild-type sibling controls (left panel), larvae homozygous for the slc12a2bue58 mutation (right panel) show disrupted myelin morphology (white arrowheads). Scale bars = 20 µm. h Single mbp:mem Scarlet-expressing oligodendrocytes in wild-type (left panel) and slc12a2bue58 heterozygote siblings (right panel) at 4dpf. Scale bars = 20 µm. i Example time course showing the development of the myelin phenotype in single mbp:mem Scarlet-expressing oligodendrocytes in slc12a2bue58 homozygous mutants from 4 to 6dpf. White arrowheads point to localized areas of myelin disruption. Scale bar = 20 µm.
|