|
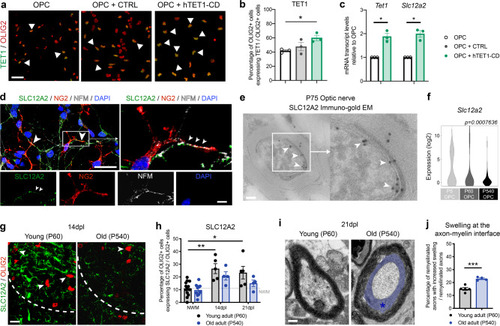
The protein encoded by the TET1-target gene Slc12a2 is localized at the axon–myelin interface.a Representative images of cultured OPCs, transduced with the indicated lentiviral vectors and then stained for TET1 (green) and OLIG2 (red). White arrowheads indicate co-labeled cells. Scale bar = 25 µm. b Quantification of the percentage of OLIG2 + cells expressing TET1 in untransduced OPC and in cells transduced either with CTRL or hTET1-CD lentiviral vectors. Error bars represent SEM in n = 3 independent experiments (*p < 0.05, one-way ANOVA). c Quantitative real-time PCR analysis of Tet1 and Slc12a2 transcript levels in immunopanned OPCs after transfection with hTET1-CD lentivirus. Data represent average transcript levels relative to untransfected OPCs in n = 3 independent experiments. Error bars represent SEM (*p = 0.0232 for Tet1, *p = 0.0192 for Slc12a2, Student’s t test two-tailed). d Confocal image of mixed neuronal/glial cortical cultures. SLC12A2 (in green) is expressed by differentiating oligodendrocyte progenitors (co-stained with NG2, in red), and localized at contact points with axons (stained with NFM, in white). DAPI (blue) used as nuclear counterstain. White arrowheads indicate NFM + and NG2 + neuron-glial contact points co-labeled with SLC12A2. Scale bars = 50 µm and scale bars = 10 µm for high magnification images. e Immunogold staining for SLC12A2 on EM imaging in adult P75 WT optic nerves, showing the localization of SLC12A2 at the axon–myelin interface (white arrow-heads). Scale bar = 5 µm and scale bar = 1 µm for high magnification images. f Violin plots of Slc12a2 transcript levels in nOPC at P5 (n = 61 single cells), aOPC at P60 (n = 76 single cells), and oOPC at P540 (n = 51 single cells). Note the age-dependent decline of Slc12a2 transcripts (one-way ANOVA, for age). g Representative confocal image of young and old spinal cord sections, stained 14 days after lesion for SLC12A2 (green) and OLIG2 (red). The dotted white line indicates the lesion border. White arrowheads indicate co-labeled cells. Scale bar = 50 μm. h Quantification of in the percentage of OLIG2 + cells expressing also SLC12A2 in young and old lesioned spinal cords at 14dpl and 21dpl. Dotted gray line across indicates the percentage of OLIG2 + cells expressing SLC12A2 in unlesioned white matter tracts (NWM). Data represent average values quantified in 4 sections/mouse for n = 5 young and n = 4 old mice (*p < 0.05 and **p < 0.01, two-way ANOVA, for age and time after lesion). i Representative electron micrographs of young and old spinal cord sections at 21dpl, revealing increased swelling at the axo-myelinic interface (blue area and * asterisk). Scale bar = 10 µm. j Quantification of the percentage of remyelinated axons with swelling at the neuro-glial interface in young and old spinal cord lesions at 14dpl. Data represent the average values. Error bars represent SEM for n = 5 young and n = 4 old mice (***p = 0.0005, Student’s t test two-tailed).
|