|
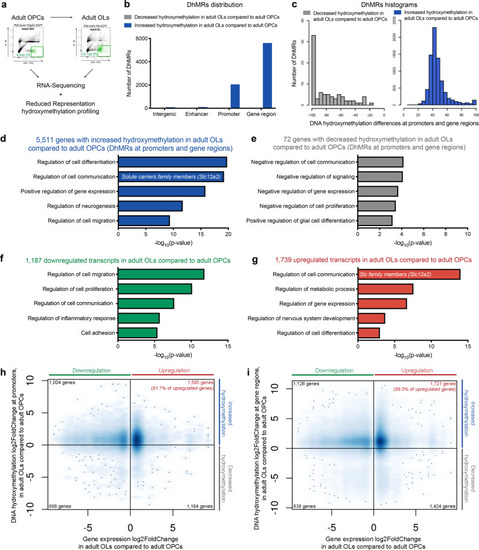
DNA hydroxymethylation and gene expression in sorted adult oligodendrocyte progenitors and adult oligodendrocytes.a Flow-activated cell-sorting of adult OPCs from Pdgfra-H2BEGFP and adult OLs from Plp-EGFP mice followed by RNA and DNA extraction and processing for RNA-Sequencing and RRHP DNA hydroxymethylation analysis. b Gene features distribution of differentially hydroxymethylated (DhMR) regions in aOLs relative to aOPCs. The bar graphs indicate the number of regions with increased (blue) or decreased (gray) hydroxymethylation at intergenic, enhancer, promoter, and gene regions. c Histograms of the overall distribution of hypo- (gray) and hyper- (blue) hydroxymethylated regions between aOLs and aOPCs samples. The bar graphs identify the number of DhMR at each level of decile DNA hydroxymethylation difference. d Ontology categories of the 5511 genes with increased hydroxymethylation, corresponding to the following GO, in decreasing order (from top to bottom: GO:0030154, GO:0010646, GO:0010628, GO:0050767, GO:0030334 (blue). e Only 72 genes showed decreased hydroxymethylation (gray), in aOLs compared to aOPCs, as defined by the RRHP analysis. f Gene ontology categories of the 1187 transcripts downregulated (green) in aOLs compared to aOPCs. From top to bottom, GO:0030334, GO:0042127, GO:0010646, GO:0050727, GO:0007155. g Gene ontology categories of the 1739 transcripts upregulated (red) in aOLs compared to aOPCs, as identified by RNA Sequencing analysis. From top to bottom, GO:0050794, GO:0019222, GO:0010468, GO:0051960, GO:0045595. h, i Quadrant plot of the relationship between genes with differential hydroxymethylation at promoters (h) or gene regions (i) and differential transcript (aOLs vs. aOPCs). The x axis indicates log2 fold change of transcript levels. The y axis refers to DNA hydroxymethylation differences. Note the “hot spot” (blue cloud of dots) identifying the abundance of genes with increased hydroxymethylation at promoters and gene regions associated with upregulated transcripts.
|