FIGURE

Figure 5

ID
ZDB-FIG-210519-45
Publication
Kapsokalyvas et al., 2021 - Multiview deconvolution approximation multiphoton microscopy of tissues and zebrafish larvae
Other Figures
All Figure Page
Back to All Figure Page
Figure 5

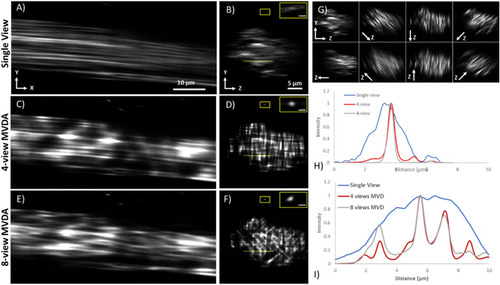
Rat-tail tendon imaging based on SHG. Single view (A) XY plane, (B) YZ plane (sagittal section). 4-view Multiview deconvolution (C) XY plane (D) YZ plane (sagittal section). 8-view Multiview deconvolution (E) XY plane (F) YZ plane (sagittal section). (G) YZ planes (sagittal sections) of all individual registered views. The direction of the Z-axis is indicated in each view. (H) Normalized intensity plot profiles of the fibre on the insets of (B), (D), and (F) contrast has been increased for visualization. (I) Normalized intensity plot profiles of the dotted lines in (B), (D), and (F). More individual fibres are revealed in the profiles of 4-view MVDA and 8-view MVDA. Scale bar on the inset of (B), (D), (F) 1 μm. (Images were created with Fiji26).

Expression Data

Expression Detail
Antibody Labeling
Phenotype Data

Phenotype Detail
Acknowledgments
This image is the copyrighted work of the attributed author or publisher, and ZFIN has permission only to display this image to its users. Additional permissions should be obtained from the applicable author or publisher of the image. Full text @ Sci. Rep.