|
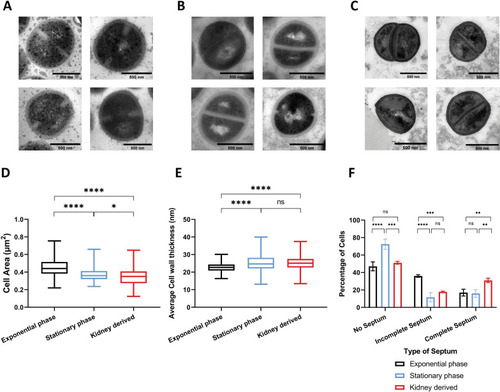
TEM analysis of <italic>S</italic>. <italic>aureus</italic> NewHG grown <italic>in vitro</italic> and <italic>in vivo</italic>.Thin sections of chemically fixed S. aureus NewHG kanR (SJF 3680) cultured in TSB to (A) exponential or (B) stationary phase or (C) recovered from murine kidneys (72 hpi). Scale bars (black line) represent500 nm. (D) Cell area of NewHG kanR cultured in TSB to exponential phase (3 independent repeats totalling 411 cells), in TSB to stationary phase (3 independent repeats totalling 320 cells) or recovered from murine kidneys (72 hpi) (2 independent repeats totalling 180 cells). Results analysed using a one-way ANOVA with multiple comparisons (* p = 0.0364, **** p < 0.0001). (E) Average cell wall thickness of NewHG kanR cultured in TSB to exponential phase (black lines, 3 independent repeats totalling 367 cells), in TSB to stationary phase (blue lines, 3 independent repeats totalling 256 cells) or recovered from murine kidneys (72 hpi) (red lines, 2 independent repeats totalling 104 cells). Results analysed using a one-way ANOVA with multiple comparisons (**** p < 0.0001). Box and whiskers for (D) and (E) represent mean, lower and upper quartiles, and range respectively. (F) Normalised percentage of NewHG kanR that show no, incomplete or a completed septum. Normalised proportions were compared using a two-way ANOVA with multiple comparisons with Tukey’s correction (no septa *** p = 0.0001, **** p < 0.0001; incomplete septa *** p = 0.0007, **** p < 0.0001; complete septa ** p = 0.0034 and 0.0057). Error bars represent the standard deviation of the mean. (Exponential phase cultured in TSB–black bars, stationary phase cultured in TSB–blue bars, cells recovered from murine kidney homogenate–red bars).
|