FIGURE

Figure 5

ID
ZDB-FIG-201130-71
Publication
Küssau et al., 2020 - Functional Characterization of the N-Acetylmuramyl-l-Alanine Amidase, Ami1, from Mycobacterium abscessus
Other Figures
All Figure Page
Back to All Figure Page
Figure 5

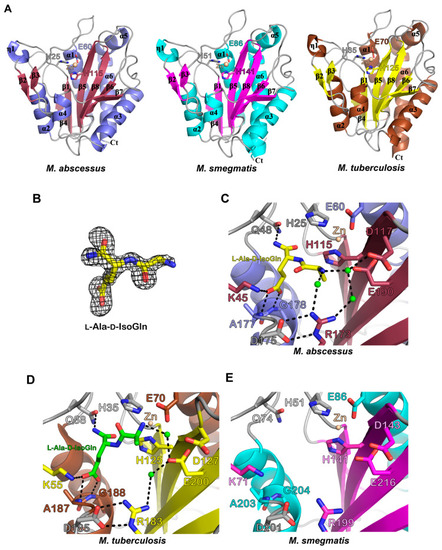
Structural comparisons of the Ami1Mab, Ami1Mtb, and Ami1Msm. (A) Overall crystal structure of Ami1Mab (left), Ami1Msm (middle) and Ami1Mtb (PDB id: 4LQ6) (right). Each structure is shown as a cartoon representation and is colored differently and according to its secondary structures. α, β, and η indicate alpha-helices, beta-strands, and 310 helices, respectively. The catalytic zinc ion (Zn2+) appears as a wheat-colored sphere. (B) Fo-Fc simulated-annealed OMIT map. The electron density map as seen in the Ami1Mab:dipeptide co-crystal structure and surrounding l-Ala-d-IsoGln (yellow sticks) is displayed as a grey mesh and contoured at 3 σ level. (C) Close up of the active site of Ami1Mab as seen in the Ami1Mab: dipeptide co-crystal structure. l-Ala-d-IsoGln (yellow sticks) tightly interacts by H-bonding and salt-bridge as illustrated by the dashed lines. Water molecules appear as green spheres. (D) The figure shows the molecular interactions seen in the co-crystal structure of Ami1Mtb bound to dipeptide (PDB id: 4M6G). (E) Active site of the Ami1Msm.

Expression Data

Expression Detail
Antibody Labeling
Phenotype Data

Phenotype Detail
Acknowledgments
This image is the copyrighted work of the attributed author or publisher, and ZFIN has permission only to display this image to its users. Additional permissions should be obtained from the applicable author or publisher of the image. Full text @ Cells