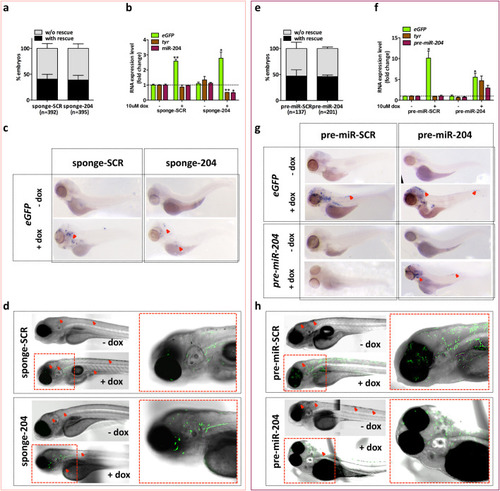
Inducible modulation of miR-204 expression levels in embryos of the Tg(mitfa:BRAFV600E);p53−/−;mitfa−/− line. (A) Embryos injected with miniCoopR-I-sponge-SCR or miniCoopR-I-sponge-204 were observed at 7 dpf. The percentage of embryos with and without melanocyte rescue does not differ significantly between the two experimental groups. (B–D) 1-cell embryos injected with miniCoopR-I-sponge-SCR or miniCoopR-I-sponge-204 were selected at 48 hpf for melanocyte rescue and treated with 10 uM dox for 2 days, then the levels of eGFP, tyr and mature miR-204 were measured by qRT-PCR (B), eGFP mRNA was detected by ISH (C) and eGFP fluorescent protein was detected by confocal microscopy (D). (E) Embryos injected with miniCoopR-I-pre-miR-SCR or miniCoopR-I-pre-miR-204 were observed at 7 dpf. The percentage of embryos with and without melanocyte rescue does not differ significantly between the two experimental groups. (F–H) 1-cell embryos injected with miniCoopR-I-pre-miR-SCR or miniCoopR-I-pre-miR-204 were selected at 48 hpf for melanocyte rescue and treated with 10 uM dox for 2 days, then the levels of eGFP, tyr and pre-miR-204 were measured by qRT-PCR (F), eGFP and pre-miR-204 RNAs were detected by ISH (G) and eGFP fluorescent protein was detected by confocal microscopy (H). Red arrows indicate rescued melanocytes, which are visible independently from dox treatment, * indicates statistically significant differences, *P<0.05, **P<0.01.
|
