|
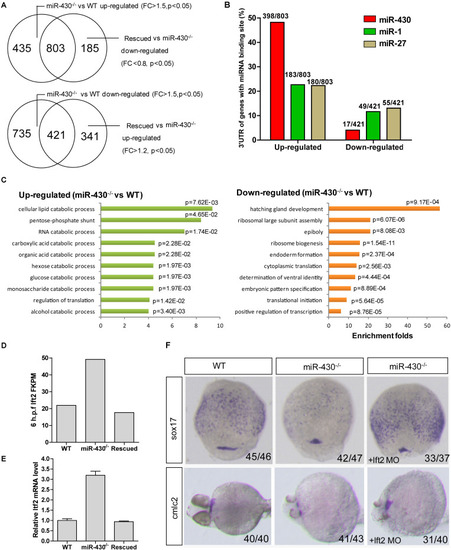
Transcriptome analysis. Total mRNAs of embryos from WT, miR-430–/– mutant and rescued groups were collected at shield stage for transcriptome sequencing. (A) Identification of miR-430-regulated genes. (B)MiR-430 binding site analysis. The ratios indicate the numbers of genes with canonical sites of the indicated miRNA in their 3′UTR/total number of analyzed genes. The miRNA binding sites were predicted by TargetScanFish 6.2. (C) GO analysis of the miR-430 regulated genes, performed by the DAVID system. (D) The expression of lft2 in the transcriptome of the WT, miR-430–/– and rescued embryos. (E) Q-PCR analysis of lft2 mRNA expression levels in the WT, miR-430–/– and rescued group. Data are expressed as mean values ± S.E.M (n = 4). (F) MO knockdown of lft2 partially rescued the miR-430-deficient phenotypes. The embryos were collected at 75% epiboly and 36 hpf for WISH analysis of marker gene expression.
|