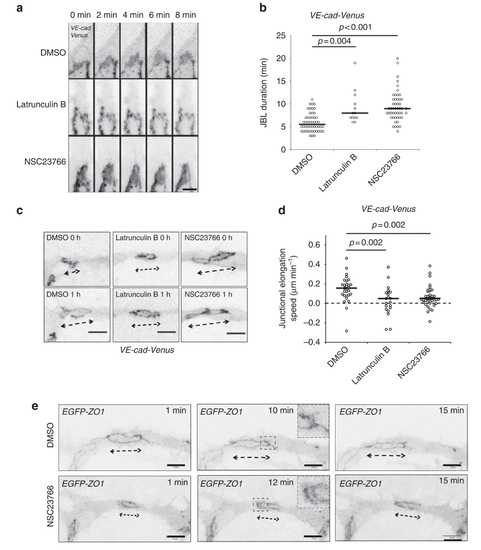
Junction elongation and JBL formation are functionally linked. a Still images from a movie of an VE-cad-Venus expressing embryo Tg(BAC(cdh5:cdh5-ts)) during anastomosis in the DLAV (around 32 hpf), in the presence of DMSO (1%), Latrunculin B (150 ng ml−1) or NSC23766 (900 µM). b Scatter plot quantitation of the duration of the JBL. DMSO, n = 50 (6 movies); Latrunculin B, n = 13 (5 movies); NSC23766, n = 49 (10 movies); black lines show median values. Non-parametric Kruskal–Wallis statistical test was used. c Confocal images of a Tg(BAC(cdh5:cdh5-ts)) embryo during junctional elongation after DLAV anastomosis. Top panels t = 0 and bottom panels after 1 h incubation. d Quantification of the junctional elongation velocity in the presence of different chemicals using Tg(BAC(cdh5:cdh5-ts)) embryos. DMSO (1%), n = 29 junctions (11 embryos); Latrunculin B (150 ng ml−1), n = 21 (6 embryos); NSC23766 (300 µM), n = 41 (11 embryos). Dotted line indicated no movement observed, black lines are medians. Non-parametric Kruskal–Wallis statistical test was used. e Confocal images of anastomosing DLAV of EGFP-ZO1 embryos (Tg(fli:Gal4ffubs3;UAS:EGFP-hZO1ubs5)) treated with DMSO or NSC23766. Scale bar 10 µm
|
