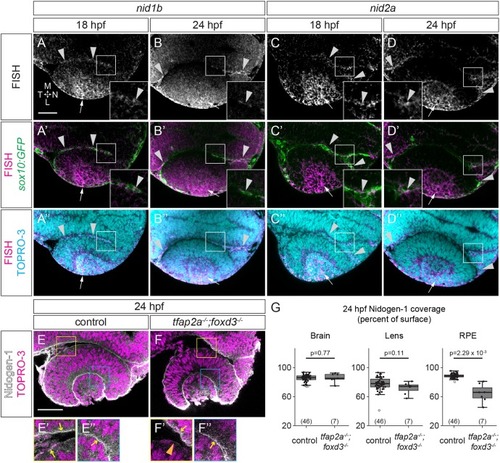
Nidogen mRNA and protein are expressed around the developing eye. (A-D″) Fluorescence in situ hybridization (FISH) for nid1b (A,B) and nid2a (C,D) in Tg(sox10:GFP) embryos. (A′-D′) FISH (magenta) merged with sox10:GFP expression (green) to visualize colocalization between FISH and GFP+ neural crest (arrowheads). (A″-D″) FISH merged with nuclei (TO-PRO-3, cyan). Arrows mark lens expression. (E-F″) Immunofluorescence for nidogen 1. In 24 hpf control embryos, nidogen 1 protein (grayscale) is detected along the brain and RPE (yellow box in E, arrows in E′) and lens-retina interface (blue box in E, arrow in E″). In 24 hpf tfap2a;foxd3 mutants, nidogen 1 is discontinuous around the RPE (F′, orange arrowhead), but still lines the brain (F′, arrow) and lens-retina interface (F″, arrow). (G) Measurements of nidogen 1 protein coverage around the brain, lens and RPE. Percentages were calculated by dividing the length of antibody labeling over the total tissue surface length. P-values calculated using Welch's t-test. n (embryos) shown at base of graphs. Scale bars: 50 µm. Dorsal view, single confocal sections. L, lateral; M, medial; N, nasal; T, temporal.
|
