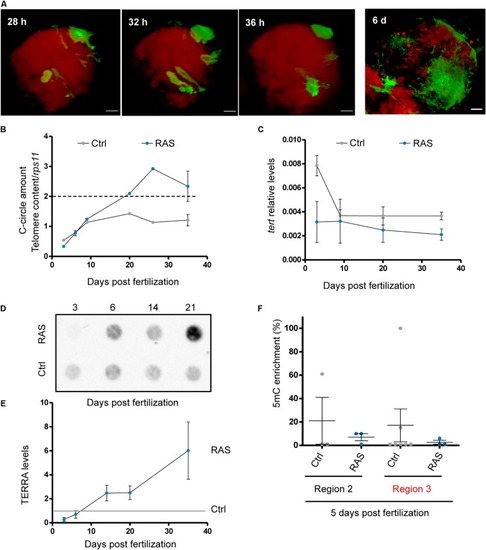
Development of ALT is preceded by a reduction of tert expression. (A) Representative images of tumor development from single cancer initiating clones to tumoral masses. h: hours; d: days. (B) C-Circle assay measured by telomeric qPCR during tumor development in control and RAS brains. Data are represented as CCA amount normalized to telomere content (TC) and single copy gene (rps11). The dashed line indicates the level above which ALT activity is considered significant Bars represent mean ± SEM. (C) RT-qPCR analysis of tert expression during tumor development. The data were normalized first to rps11 mRNA levels and are expressed as 2 (–ΔCt). Bars represent mean ± SEM. The experiment was replicated almost three times for each time points. (D) Representative dot blot of TERRA levels during tumor development (500 ng of total RNA was spotted for all samples) and (E) quantification of three independent experiments. Background was removed and values were normalized to the levels of TERRA in controls of the same larval stages (gray line). F) qPCR analysis of DNA methylation (5-methylcytosine, 5mC-ChIP) status of the tert promoter in 5 dpf control (n = 3–5) and RAS (n = 3) fish larvae. Two regions of the promoter (see Figure 2C) were analyzed, the red color of region 3 indicates a putative CpG island. Values were normalized first to rps11 and then to 5mC vs. IgG enrichment, which is set at 1.0.
|
