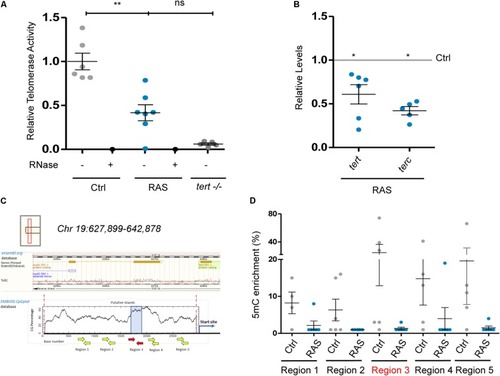
Telomerase is not involved in telomere maintenance in zebrafish brain tumors. (A) Relative telomerase activity measured by Q-TRAP in control, RAS and tert-/- brains, using 1 μg of protein extracts. RNase treatment (+) was used as a negative control to confirm the specificity of the assay, n = 6; **p = 0.005. (B) Expression of zebrafish tert and terc mRNA in brain tumors measured by RT-qPCR. Values were normalized to rps11 mRNA levels and are relative to tert and terc expression in control brains (gray line set at 1.0) n = 6; *p < 0.05. (C) Schematic representation of the genomic region harboring putative CpG island on the tert promoter, according to Ensemble (upper panel) and EMBOSS CpG plot (lower panel) databases. Position of primers used in ChIP experiments is shown as arrows. Red arrows show primers amplifying a putative CpG island. (D) qPCR analysis of DNA CpG Methylation (5-methylcytosine) status of the tert promoter in control and brain tumors of 2 month old fishes. Different regions of the promoter were analyzed, red arrows indicate the position and primers for a putative CpG island. Values were normalized first to rps11 and then to 5mC enrichment, with IgG enrichment set at 1.0. Bars in a, b, e represent mean ± SEM. n = 4–6. Ctrl: control brain, RAS: brain tumor.
|
