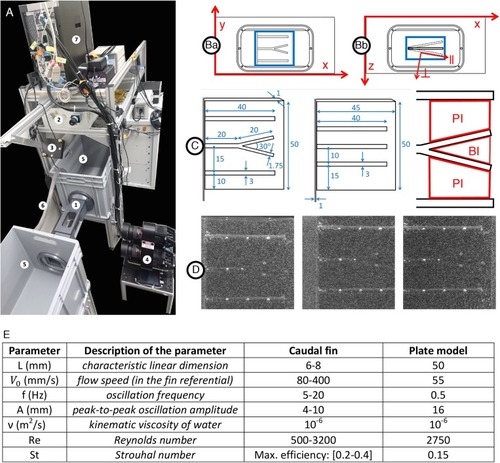
Experimental setup for hydrodynamics measurement. (A1) Flow chamber with transparent windows on three sides and a fixation wall on one side for inserting the fin model actuated with a servomotor fixed outside the chamber. (Ba) Close-up of the flow chamber (frontal view with x and y axes) with interrogation volume in blue (∼50×50mm2) used for the 3D reconstruction of particles positions. (Bb) Close-up of the flow chamber (top view with x and y axes) with interrogation volume in blue (∼50×20mm2) used for the 3D reconstruction of particles positions. The oscillation of the plate model is illustrated including the parallel (∥) and perpendicular (⊥) axes moving with the plate and used for the velocity vector decomposition. (A2) 200 mJ dual-head pulsed Nd:YAG laser equipped with a pair of cylindrical lenses to expand the beam. (A3) Mirror to deflect the laser beam and illuminate the volume inside the flow chamber. (A4) Three cameras (4 MP, 85 mm lenses) mounted on a plate in a triangular arrangement, pointing at the flow chamber to image the 3D flow based on the triangulation principle. The distance between the cameras plate and the center of the water tunnel is∼46.5cm. (A5) Water tanks connected to both sides of the flow chamber in a recirculating system. (A6) Pipe connected to a pump carrying water from one tank to the other to control the flow inside the chamber. (A7) V3V software and synchronizer to control the timing of the laser pulses and the opening of the camera apertures. (C) Models of a fin consisting of a rigid plate supporting half-cylindrical rods including a centered bifurcated ray (left), control plate model with straight rods only (middle) and sketch of the primary (PI) and bifurcation (BI) interrays. All dimensions indicated in mm. (D) Example of raw triplet images (captured by the left, right and top cameras, respectively) with the illuminated tracer particles (∼50μm diameter) and the fin plate model rendered visible by the addition of equally spaced white dots painted directly on the rods, allowing for surface tracking throughout the oscillation period. (E) Parameters of the plate model as compared to a fin.
|
