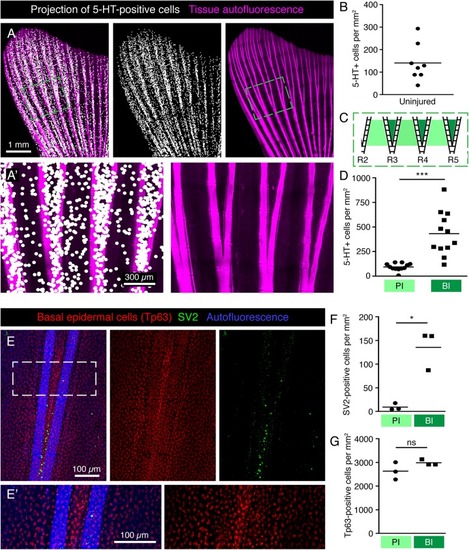
Specific pattern of HCS-cells around bifurcations in the uninjured fin. (A,A’) Projections of 5-HT-positive cells (white dots) onto fin surface with autofluorescent bones (pink) for better visualization of the HCS-cell pattern. One dot is projected at the position of each 5-HT-positive cell. (A’) Zoom of the framed area in panel (A) shows a higher density of cells between bifurcating rays. (B) Quantification of overall density of 5-HT-positive cells in uninjured fins shows high variability. Each dot represents one fin. The average density is 141 ± 82 cells per mm2. N = 8. (C) Schematic representation of an area near primary bifurcations used for the quantifications in panel (D). Primary interrays (light green) and the adjacent bifurcation interrays (dark green). (D) Quantification of 5-HT-positive cells in primary interray (PI) versus bifurcation interrays (BI) in a range of 5 ray segments after the bifurcation, as shown in panel (C). Density is approx. 4-times higher in bifurcation interrays (432 ± 222 vs. 93 ± 38 cells per mm2). N = 12. ∗∗∗p < 0.001 (E,E’) Whole mount immunofluorescent staining for SV2 (green) and Tp63 (red), which strongly labels the nuclei of the epidermis. Keratinocytes do not display the same difference in the distribution pattern around bifurcations that is seen for HCS-cells. (F) Quantification of SV2-positive cells in PI versus BI in the bifurcation areas as outlined in panel (C). Density of SV2 cells is significantly higher in BI (9 ± 7 vs. 135 ± 42 cells per mm2) ∗p < 0.05 (G) Quantification of Tp63-positive cells in PI versus BI in the bifurcation areas. No significant difference is seen in Tp63 density between PI and BI (2630 ± 364 vs. 2985 ± 125 cells per mm2). N = 3.
|
