FIGURE SUMMARY
Title

Distribution and Restoration of Serotonin-Immunoreactive Paraneuronal Cells During Caudal Fin Regeneration in Zebrafish

Authors
König, D., Dagenais, P., Senk, A., Djonov, V., Aegerter, C.M., Jaźwińska, A.
Source
Full text @ Front. Mol. Neurosci.

Schematic representation of an adult zebrafish caudal fin. (A) Live imaging of the caudal fin of an adult zebrafish. (B) Illustration shows the fan-like shape of the fin with longer lateral lobes and a shorter middle cleft. The fin fold contains 16–18 principal rays (gray) that are segmented and bifurcate once or more. (C) Close-up representation of the fin shows a repetitive ray-interray arrangement. Rays are supported by bilateral dermal bones (dark gray). The fin is covered by epidermis (epid; blue) on both sides. The inner fin tissue contains mesenchyme (light gray) with centrally located blood vessels (red). (D,E) Longitudinal sections through a ray (D) and an interray (E) display a multilayered epidermis (blue) covering the fin surface. The mesenchyme (mes) is vascularized and innervated.

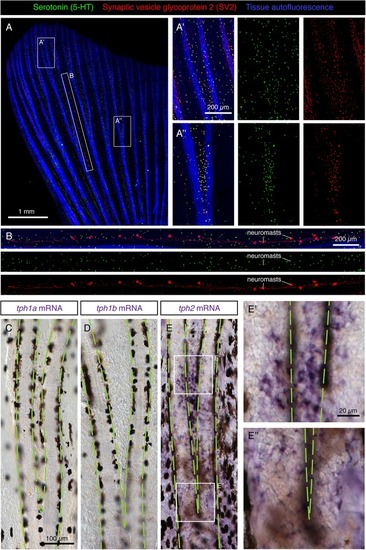
Molecular markers of HCS-cells in the adult fin epidermis. (A–C) Immunofluorescence staining of longitudinal sections of uninjured adult caudal fins; ep, epidermis, mes, mesenchyme. Dashed lines indicate the border between epidermis and mesenchyme. (A,A’) Rabbit antibody against serotonin (5-HT; green) and mouse antibody against Synaptic vesicle glycoprotein 2 (SV2; red) colocalize in single cells near the epidermal surface. (A’) A higher magnification of the framed area in panel (A) shows the vesicular and polarized distribution of both markers in the cells. (B–B”) Triple immunostaining with rat antibody against serotonin (5-HT), rabbit antibody against Calretinin and mouse antibody against Synaptic vesicle glycoprotein 2. All three markers are expressed in the same cells of the epidermis. Serotonin and SV2 are polarized while Calretinin is found throughout the cytoplasm. (C,C’) Mouse antibody against serotonin and rabbit antibody against Calretinin label the same cells. All three serotonin antibodies have identical patterns. However, both Rat-serotonin and Mouse-serotonin required high concentrations and gave weaker signals than the rabbit antibody. N ≥ 4 for each staining. Nuclei are labeled with DAPI (blue). (A’,B’,C’) Images labeled with letters with prime symbols show higher magnifications of the frames in the corresponding images. The same rule applies to all the subsequent figures.

Characterization of HCS-cells in the adult uninjured fin. (A–C) Immunofluorescence staining of longitudinal sections of uninjured adult caudal fins; ep, epidermis, mes, mesenchyme. Dashed lines indicate the border between epidermis and mesenchyme. (A,A’) Serotonin-positive cells (green) do not express Keratin (red), which demarcates surrounding epidermal cells. (B,B’) Immunostaining for Desmoplakin (green) and Calretinin (red) indicates that Calretinin-positive cells possess very few desmosomes compared to the surrounding keratinocytes. Very weak dotty Desmoplakin staining is sometimes observed at the apical side of the cell (arrowheads). (C,C’) Staining for Serotonin (green) and Zn12 (red), a neuronal marker, reveals that cells are located close to nerve fibers. N ≥ 4 for each staining. Nuclei are labeled with DAPI (blue).

Electron microscopy images of the fins reveal small round cells in the subsuperficial layer of the epidermis. (A,B,D–G) TEM images of a cross section through the epidermis of the fin. Total number of images considered = 100, 11 HCS-cells identified, for each HCS-cell up to 5 sections imaged. (A,B) The epidermis is composed of several layers of keratinocytes (Ker); the top layer being called pavement cells (PVC) with microplicae. Underneath the pavement cell layer, small round cells resemble HCS-cells. Bm: basement membrane. Col: collagen of the dermis. (A’,B’) Higher magnification of the putative HCS-cells. The cells contain a large nucleus (nuc) relative to their size, a Golgi apparatus (Ga), mitochondria (m) and vesicles (v). Unlike adjacent cells, the HCS-cells do not have desmosomes (d), however they are in contact with nerve fibers (n). (C) SEM image of the fin surface. The pavement cells (PVC) are covered with ridges called microplicae. N = 4 (D–G) Enlargement of features of HCS-cells in panels (A’,B’): Golgi apparatus (D), Nerve fiber adjacent to HCS cell and vesicle in the cytoplasm of HCS cell (E), large mitochondria (F), Neuronal projection touching HCS cells (G).

Scattered distribution of HCS-cells in uninjured adult fins. (A,B) Whole-mount immunofluorescence staining of uninjured fins for serotonin (5-HT; green) and SV2 (red). Tissue autofluorescence allows visualization of bony rays (blue). (A’,A”) Higher magnifications of different fin regions. The area immediately above a ray bifurcation shows a higher density of HCS-cells. N = 12. (B) A zoom of the interray region marked by an elongated frame in panel (A). Aligned multicellular aggregates of SV2-positive and 5-HT-negative cells represent mechanosensory neuromasts. (C–E”) Whole mount in situ hybridization of uninjured fins for rate-limiting enzymes in the synthesis of serotonin tph1a, tph1b and tph2. Microscopic images near a bifurcation area (bifurcating bones highlighted with green dashed lines). tph1a and tph1b are not detected, while tph2 is expressed in a dotty pattern in the epidermis with a higher density between the bifurcating bones (E,E’,E”). N = 3 for each probe.

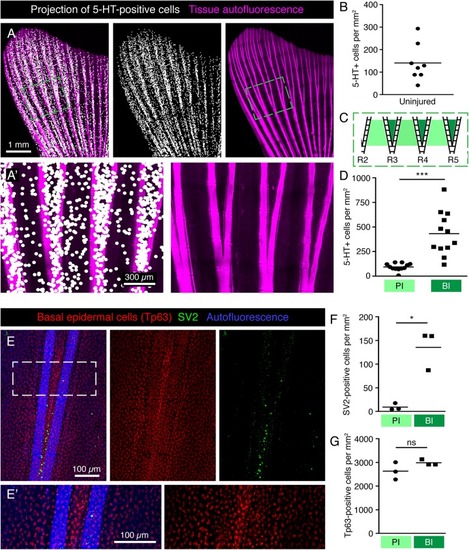
Specific pattern of HCS-cells around bifurcations in the uninjured fin. (A,A’) Projections of 5-HT-positive cells (white dots) onto fin surface with autofluorescent bones (pink) for better visualization of the HCS-cell pattern. One dot is projected at the position of each 5-HT-positive cell. (A’) Zoom of the framed area in panel (A) shows a higher density of cells between bifurcating rays. (B) Quantification of overall density of 5-HT-positive cells in uninjured fins shows high variability. Each dot represents one fin. The average density is 141 ± 82 cells per mm2. N = 8. (C) Schematic representation of an area near primary bifurcations used for the quantifications in panel (D). Primary interrays (light green) and the adjacent bifurcation interrays (dark green). (D) Quantification of 5-HT-positive cells in primary interray (PI) versus bifurcation interrays (BI) in a range of 5 ray segments after the bifurcation, as shown in panel (C). Density is approx. 4-times higher in bifurcation interrays (432 ± 222 vs. 93 ± 38 cells per mm2). N = 12. ∗∗∗p < 0.001 (E,E’) Whole mount immunofluorescent staining for SV2 (green) and Tp63 (red), which strongly labels the nuclei of the epidermis. Keratinocytes do not display the same difference in the distribution pattern around bifurcations that is seen for HCS-cells. (F) Quantification of SV2-positive cells in PI versus BI in the bifurcation areas as outlined in panel (C). Density of SV2 cells is significantly higher in BI (9 ± 7 vs. 135 ± 42 cells per mm2) p < 0.05 (G) Quantification of Tp63-positive cells in PI versus BI in the bifurcation areas. No significant difference is seen in Tp63 density between PI and BI (2630 ± 364 vs. 2985 ± 125 cells per mm2). N = 3.

DASPEI-positive cells in the uninjured fin do not display a HCS-like distribution pattern. (A–C) Live imaging of DASPEI-stained (green) uninjured fins. (A,A’) Image of a fin around the first bifurcation level. No specific pattern of DASPEI-positive cells is observed around the bifurcation. (B) The same image as shown in panel (A) with a white dot projections of DASPEI-positive cells. Larger DASPEI-positive bundels aligned between the rays are neuromasts (yellow circles). (C) Image of a fin in the proximal region of the fin with white dots projected over solitary DASPEI-positive cells. DASPEI-positive neuromasts are clearly visible (yellow circle). (D) Quantification of overall density of DASPEI-positive solitary cells per mm2 in the fins. Overall density was 42 ± 15 cells per mm2, much lower that the overall density of HCS-cells. (E) Density pattern around bifurcation areas quantified according to the areas highlighted in Figure 6C. Density of DASPEI-positive cells in the PI was not significantly different from the density in the BI (87 ± 35 vs. 104 ± 61 cells per mm2). N = 5.

Distribution of HCS-cells in alf mutants and during ontogenesis of wild type zebrafish. (A) Projections of 5-HT-positive cells (white dots) in an uninjured alf fin based on immunofluorescence staining of the rays. Autofluorescence of tissue with bones (pink). (A’) Zoom of the framed region in panel (A) shows higher density of HCS-cells in bifurcation interrays, like in wild type fins. (B) Quantification of HCS-cell density in alf fins versus wild-type fins shows a significantly higher overall density of HCS-cells in alf fins (113 ± 60 vs. 210 ± 30 cells per mm2). N ≥ 3. p < 0.05. (C) Quantification of HCS-cell density in primary interray (PI) vs. bifurcation interray (BI) in wild-type versus alf fins. Density difference is present in alf fins (104 ± 20 vs. 426 ± 196 cells per mm2 in wild type and 166 ± 112 vs. 729 ± 277 in alf). N ≥ 3. ∗∗∗p < 0.001. (D) Projections of 5-HT-positive cells in fins at different ages ranging from 14 days to 24 months post-fertilization (dpf and mpf), based on immunofluorescence staining. For juvenile stages, the developmental stage is shown as standardized standard length (Parichy et al., 2009). (E) Quantification of density of 5-HT-positive cells in caudal fins during post-embryonic ontogenesis. While the density is lower at larval stages, once fins switch to a bi-lobed morphology, the concentration of HCS-cells increases and remains constant through the adult life of the fish (7 ± 5 at 14 dpf; 38 ± 30 at 21 dpf; 68 ± 25 at 30 dpf; 152 ± 60 at 60 dpf; 164 ± 95 at 12 months and 140 ± 82 at 24 months). N ≥ 2.

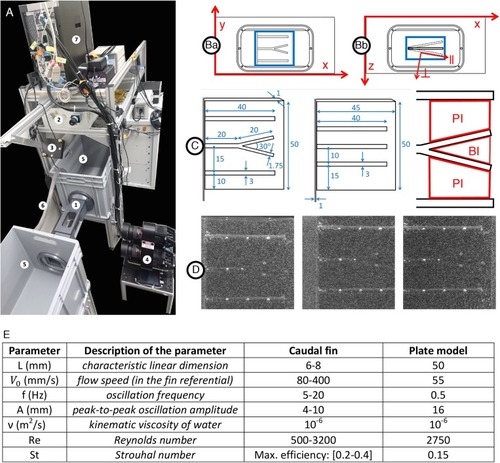
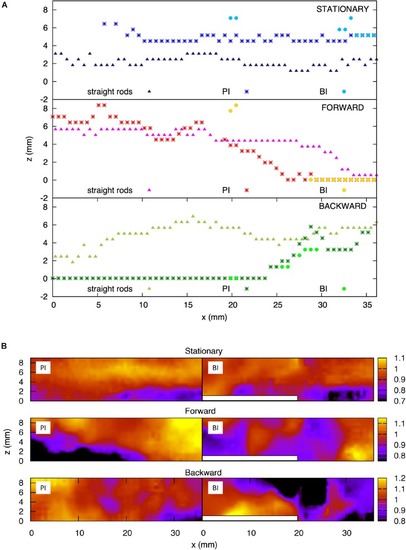
Experimental setup for hydrodynamics measurement. (A1) Flow chamber with transparent windows on three sides and a fixation wall on one side for inserting the fin model actuated with a servomotor fixed outside the chamber. (Ba) Close-up of the flow chamber (frontal view with x and y axes) with interrogation volume in blue (∼50×50mm2) used for the 3D reconstruction of particles positions. (Bb) Close-up of the flow chamber (top view with x and y axes) with interrogation volume in blue (∼50×20mm2) used for the 3D reconstruction of particles positions. The oscillation of the plate model is illustrated including the parallel (∥) and perpendicular (⊥) axes moving with the plate and used for the velocity vector decomposition. (A2) 200 mJ dual-head pulsed Nd:YAG laser equipped with a pair of cylindrical lenses to expand the beam. (A3) Mirror to deflect the laser beam and illuminate the volume inside the flow chamber. (A4) Three cameras (4 MP, 85 mm lenses) mounted on a plate in a triangular arrangement, pointing at the flow chamber to image the 3D flow based on the triangulation principle. The distance between the cameras plate and the center of the water tunnel is∼46.5cm. (A5) Water tanks connected to both sides of the flow chamber in a recirculating system. (A6) Pipe connected to a pump carrying water from one tank to the other to control the flow inside the chamber. (A7) V3V software and synchronizer to control the timing of the laser pulses and the opening of the camera apertures. (C) Models of a fin consisting of a rigid plate supporting half-cylindrical rods including a centered bifurcated ray (left), control plate model with straight rods only (middle) and sketch of the primary (PI) and bifurcation (BI) interrays. All dimensions indicated in mm. (D) Example of raw triplet images (captured by the left, right and top cameras, respectively) with the illuminated tracer particles (∼50μm diameter) and the fin plate model rendered visible by the addition of equally spaced white dots painted directly on the rods, allowing for surface tracking throughout the oscillation period. (E) Parameters of the plate model as compared to a fin.

Fluid velocity profiles in the bifurcation interray zone (BI) and the primary interray zone (PI) highlight particular fluid motion at the interray bifurcation site. (A,B) Models of a fin consisting of a rigid plate supporting half-cylindrical rods used for the hydrodynamic profiles study in a version with three parallel rods (A), and a bifurcation in the central ray (B). The indicated primary interray areas (PI) and bifurcation interray area (BI) are used for the velocity components averages presented below. (C–F) Flow profiles (all color scales in meters per second) at two key positions during the plate’s oscillation period. The corresponding average measurements are shown in Figures 11B,C. (C,E) A lower fluid velocity parallel to the surface (V//) is typically associated with a thicker boundary layer, and hence a potentially better detection of chemical signal in the bifurcation region, owing to longer time reaction for the cellular receptors and better averaging of the signal. (D) Larger absolute values of the perpendicular velocity (V < 0) indicate a higher rate of fluid motion directly toward the bifurcation region and imply a better access to molecules advected by the fluid from outside the boundary layer. (F) The vertical velocity component (Vy) also reveals a global fluid motion toward the inter-bifurcation region (illustrated by the white arrows), naturally correlated with a movement perpendicularly away from the fin as indicated by the positive value of V in Figure 11C. The velocity fields correspond to averages over three (0° angle) to five timeframes (max. angle).

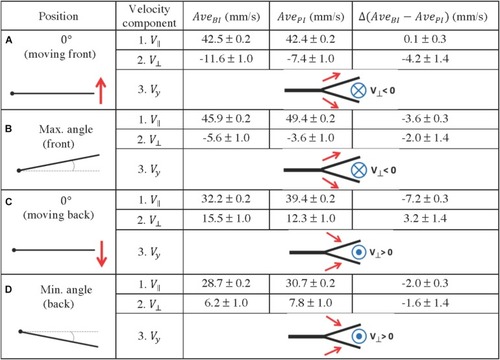
Quantification of fluid profiles in the bifurcation interray zone (BI) and the primary interray zone (PI), at four equidistant positions of the fin model during a complete period. (A–D) Four key points were selected along a full period of oscillation as indicated in the left column. A schematic depiction of the vertical velocity component (Vy) is represented by the simplified diagrams in the right column, in which the red arrows symbolize the Vy vectors, pointing toward or away from the bifurcation region. The blue symbols represent the resulting fluid motion in the perpendicular direction, namely the V vectors, pointing outward (circle with a dot in the middle) or inward (circle with a cross in the middle). The average velocity components parallel and perpendicular to the plate (V// and V) are indicated in millimeters per second. They are noted AveBI or AvePI depending on the averaging surface (BI region or PI region), and the difference between the averages Δ(AveBI – AvePI) is also shown.

Analysis of the boundary layer on scaled fin models. (A) Boundary layer thickness for the plate model with straight rods, and for the plate model with a bifurcated middle rod, at the primary interray and the bifurcation interray zones. Top panel: Stationary plate. Middle panel: Zero-degree angle position during forward motion of the plate. Bottom panel: Zero-degree angle position during backward motion of the plate. (B) Color map of the streamwise velocity component (V||) normalized by the average value – top view of the flow chamber vis-a-vis the primary interray (PI) and the bifurcation interray (BI). Top panel: Stationary plate. Middle panel: Zero-degree angle position during forward motion of the plate. Bottom panel: Zero-degree angle position during backward motion of the plate.

Restoration of HCS-cells during fin regeneration after amputation. (A–E) Projections of 5-HT-positive cells (as detected by immunofluorescence) on whole mount uninjured fins, at 2 days post-amputation (dpa), 7, 14, and 30 dpa. The formation of the new outgrowth distal to the amputation plane (dashed line) is associated with concomitant restoration of HCS-cells. (A’–E’) Higher magnification of areas in squares in corresponding image. (F) Quantification of overall HCS-cell density at the indicated time points. No significant (ns) difference in density during regeneration compared with uninjured fins (126 ± 67 cells per mm2 in uninjured; 102 ± 77 at 2 dpa; 88 ± 39 at 7 dpa; 109 ± 50 at 14 dpa; 84 ± 21 at 30 dpa). N ≥ 7. (G) Quantification of HCS-cell density in primary interray (PI) vs. bifurcation interray (BI) in uninjured fins vs. fin regenerates at 30 dpa, as illustrated in Figure 6C. Differential density is reestablished after regeneration (75 ± 43 vs. 386 ± 291 cells per mm2 in uninjured and 40 ± 18 vs. 178 ± 64 at 30 dpa). N ≥ 7. ∗∗∗p < 0.001.

Low proliferative rate of mature HCS-cells during fin regeneration. (A) Immunofluorescent staining for SV2 (green) and PCNA (red) on sagittal section of fin wound epidermis at 3 dpa. (A’) SV2-positive cells are PCNA-negative (arrowheads). (B) Proportion of PCNA-positive cells among SV2-positive HCS-cells versus in SV2-negative epidermal cells (2.3% PCNA-positive in HCS-cells versus 13.8% PCNA-positive in other cells). N = 3. Number of cells for each group indicated on graph. (C) Experimental design for BrdU assays. (D,F) Immunofluorescence staining of whole mount fins at 3 dpa for serotonin (green) and BrdU (red) after 18 h or 48 h of BrdU-treatment. The image shows confocal imaging through the epidermis distal to the amputation plane (dashed line). (D’,F’) Zoomed areas show BrdU-negative (white arrowhead) and BrdU-positive (yellow arrowhead) 5-HT-positive cells. (E,G) Proportion of BrdU-positive cells among 5-HT-positive cells after 18 and 48 h of labeling (5.4 and 71%, respectively). N = 3 fins; total number of cells in each group indicated on graph.

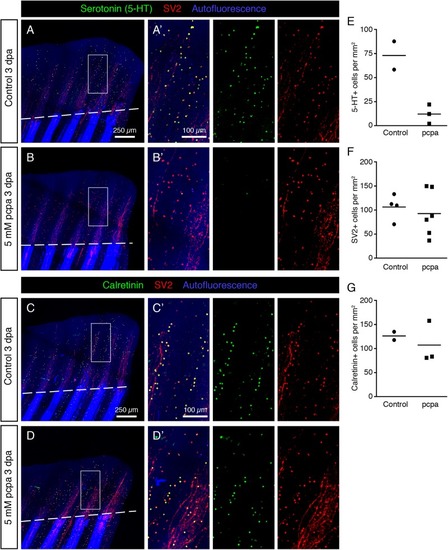
Inhibition of Serotonin production by pcpa-treatment does not prevent HCS-cell regeneration. (A,B) Whole mount immunofluorescent staining for 5-HT and SV2 in pcpa-treated (B) and control (A) fins at 3 dpa. Pcpa treatment eliminates serotonin, but does not eliminate SV2 expression in HCS-cells. (A’,B’) The treatment does not prevent HCS-cell regeneration. (C,D) Whole mount immunofluorescence staining for Calretinin and SV2 in pcpa-treated (D) and control (C) fins at 3 dpa. Pcpa-treatment does not suppress the Calretinin expression in SV2-positive cells (C’,D’). (E) Density of 5-HT-positive cells in pcpa-treated fins decreased dramatically as compared to control fins, validating the activity of pcpa (72 ± 21 vs. 12 ± 10 cells per mm2). N ≥ 3. (F) Density of SV2-positive cells is similar in control and pcpa-treated fins (106 ± 26 vs. 92 ± 47 cell per mm2). N ≥ 3. (G) Density of Calretinin-positive cells remains unaltered despite of inhibition of serotonin production by the pcpa-treatment (126 ± 12 vs. 107 ± 44 cells per mm2). N ≥ 3.

Acknowledgments
This image is the copyrighted work of the attributed author or publisher, and ZFIN has permission only to display this image to its users. Additional permissions should be obtained from the applicable author or publisher of the image. Full text @ Front. Mol. Neurosci.