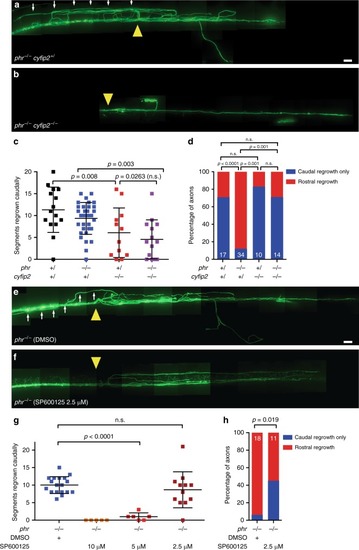
Cyfip2-deficiency and JNK inhibition rescue misdirected regrowth in phr mutant Mauthner axons. a–d Laser-mediated axon transections were performed in 4-day-old larvae with different cyfip2 and phr genotypes. Regrowth was assessed 48 hpt. A stitched image of a regrown phr mutant axon is shown in (a). A yellow arrowhead marks the previous transection site. From the transection site several projections have regrown rostrally (white arrows). In contrast, in a phr−/−cyfip2−/− double mutant, there is only caudally directed regrowth (b). Scale bar: 30 µm. Quantification of extent of caudally directed regrowth (c). Quantification of percentage of axons with rostrally misdirected regrowth (d). P-value was determined using two-tailed Student’s t-test (c) or Fisher exact test (d). N of axons (1 axon per larva) for (c) and (d) as indicated in white numbers in the bar diagram in (d), except for phr+/cyfip2−/−: 12 axons were analyzed in (c) and 10 in (d), because two did not regrow at all in either direction. Only p-values ≤ 0.017 indicated significant differences after Bonferroni correction in (c). e–h Laser-mediated axon transections were performed in 5-day-old phr−/− larvae. After transection, larvae were treated with DMSO (control) or with JNK inhibitor SP600125. Regrowth was assessed at 48 hpt. Stitched images of regrown phr mutant axons are shown (e, f), DMSO control (e), JNK inhibitor SP600125 2.5 μM treated (f). Yellow arrowheads mark previous transection sites. From the transection site, there is a rostral trajectory (white arrows) in the DMSO-treated larva. Scale bar: 30 µm. Quantification of extent of caudally directed regrowth (g). SP600125 dose-dependently reduced Mauthner axonal regrowth. At 2.5 μM extent of Mauthner axonal regrowth was not significantly reduced. P-values were determined using two-tailed Student’s t-tests (g). Quantification of percentage of axons with rostrally misdirected regrowth in DMSO- or 2.5 μM SP600125-treated larvae (h). Number of axons (one axon per larva) in (g): DMSO: n = 18; SP600125 10 μM: n = 5; 5 μM: n = 6; 2.5 μM: n = 12. Numbers in (h): DMSO: n = 18 and SP600125 2.5 μM: n = 11 (one less than in (g) because one did not regrow at all in either direction)
|
