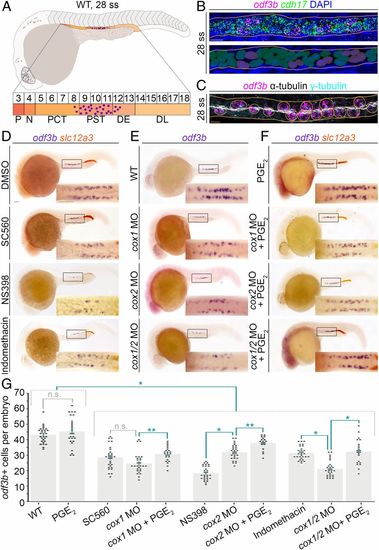
Chemical screen reveals prostaglandin signaling mediates renal MCC development in the zebrafish embryonic kidney, the pronephros. (A, Top) Schematic of a WT zebrafish embryo and pronephros at the 28 ss (lateral view) that is composed of a series of distinct functional segments with transporter cells (shades of orange) and MCCs (purple dots). The pronephros is situated along the trunk, lateral with respect to the adjacent somitic mesoderm and dorsal to the yolk and yolk sac extension. (A, Bottom) Somite map (indicated by the numbered box sequence) demarcates the location of nephron segments with respect to somites numbered 3 to 18. N, neck; P, podocyte. The formation of MCCs (purple dots) occurs in the central region of the nephron tubule, mostly located in the PST, with a few cells in the PCT and DE segments as well. (B, Top) Whole-mount smiFISH on a representative WT 28 ss embryo showing labeling for the presence of odf3btranscripts (magenta) and cdh17 transcripts (green). Nuclei are labeled with DAPI (blue), and the nephron is outlined by orange lines. (B, Bottom) Pseudocolored nuclei indicate scoring as transporter cell with cdh17+ only (green) or MCC with coexpression of cdh17+/odf3b+ (purple). (Scale bar, 10 μm.) (C) MCCs of a representative 28 ss WT embryo visualized by FISH, to label odf3b transcripts (magenta), and IF to label cilia with antiacetylated α-tubulin (white) and basal bodies with γ-tubulin (cyan). MCCs (circled in orange) exhibit odf3b expression and are distinguished by multiple ciliated basal bodies. (Scale bar, 10 μm.) (D–F) Embryos (lateral view) were labeled by WISH for the MCC marker odf3b (purple), and in D and F for the DL marker slc12a3 (orange). (D–F, Insets) Magnified dorsal views of the areas demarcated by the black boxes. (Scale bar, 50 μm.) (G) Quantification of odf3b+ cells. Each dot on the graph represents the total odf3b+ MCC number in one embryo. Data are represented as mean ± SEM; significance was determined by ANOVA, where *P < 0.0001, **P < 0.05, n.s., not significant.