|
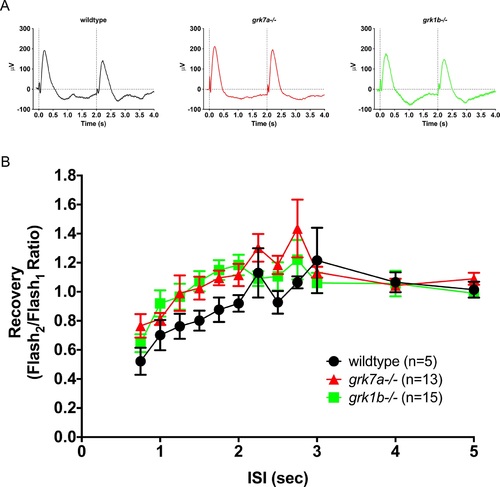
Recovery of the native ERG b-wave to successive stimuli in grk knockout zebrafish larvae. (A) Representative ERG waveforms of untreated, dark-adapted larvae subjected to successive stimuli using a dual flash paradigm of a 20-ms flash of saturating white light (1000 cd/m2) with an interstimulus interval (ISI) of 2 s. Vertical black dotted lines indicate the time of stimulus. (B) Data are plotted as the ratio of the maximum b-wave response amplitude of the second stimulus to that of the initial stimulus for ISIs ranging from 0.75 s to 5 s. A linear mixed model analysis of covariance found no significant effect of genotype when compared to wildtype for grk1b−/− (F[1,14] = 1.2; P = 0.2879) or grk7a−/− larvae (F[1,17] = 3.3; P = 0.0889). Error bars represent SEM.
|