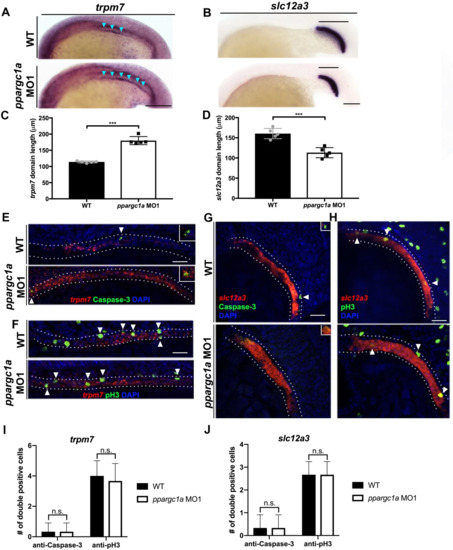
Loss of ppargc1a does result in segment changes at the 20 ss but no change in cellular turnover is observed. (A) WISH at the 20 ss for trpm7 (left) and (B) slc12a3 (right) in WT (top) and ppargc1a MO (bottom). Blue arrowheads indicate trpm7 expression in the developing pronephros. Scale bar = 100 μm. The representative graphs showing absolute length measurements of trpm7 (C) and slc12a3 (D). (E) FISH/IHC for trpm7 (red) and anti-Caspase-3 (green) with DAPI (blue) in WT (top) and ppargc1a MO1 (bottom). (F) FISH/IHC for trpm7 (red) and anti-phospho-Histone H3 (green) in WT (top) and ppargc1a MO1 (bottom). (G) FISH/IHC for slc12a3 (red) and anti-Caspase-3 (green) with DAPI (blue) in WT (top) and ppargc1a MO1 (bottom). (H) FISH/IHC for slc12a3 (red) and anti-phospho-Histone H3 (green) with DAPI (blue) in WT (top) and ppargc1a MO1 (bottom). (I) The number of trpm7/Caspase-3 or trpm7/pH3 double-positive cells is depicted. (J) The number of slc12a3/Caspase-3 or slc12a3/pH3 double positive cells is depicted. (WT quantifications = black bars, ppargc1a-deficient quantifications = white bars.) Data are represented as ±SD, significant by t test, n.s. = not significant, *** = p < 0.001.
|
