
Fig. 4
- ID
- ZDB-FIG-180911-43
- Publication
- Oosterhof et al., 2018 - Colony-Stimulating Factor 1 Receptor (CSF1R) Regulates Microglia Density and Distribution, but Not Microglia Differentiation In Vivo
- Other Figures
- All Figure Page
- Back to All Figure Page
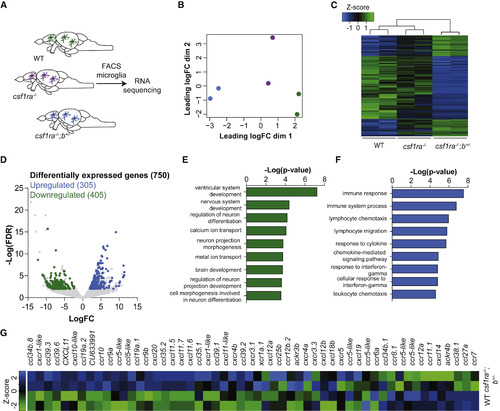
RNA Sequencing Reveals Increased Expression of Genes Associated with Chemotaxis in csf1ra−/−;b+/− Mutant Microglia (A) Schematic representation of the RNA sequencing experiment. Microglia were sorted by FACS from dissected brains from WT (3 brains per sample, 2 samples), csf1ra−/− (3 brains per sample, 2 samples), and csf1ra−/−;b+/− (4–5 brains per sample, 2 samples) zebrafish. (B) Multidimensional scaling plot. (C) Heatmap of differentially expressed genes between csf1ra−/−;b+/− and WT microglia. (D) Volcano plot of differentially expressed genes (csf1ra−/−;b+/− versus WT) whose expression values in csf1ra−/− mutants lay between those of WT and csf1ra−/−;b+/− mutants. (E and F) Gene ontology analysis was performed on genes that showed a csf1r-dependent decrease in expression (E) and increase in expression (F). (G) Heatmap with expression Z scores for all chemokines and chemokine receptors that are expressed in zebrafish microglia. Genes were differentially expressed with FDR < 0.01 and LogFC > |2|. Adult zebrafish used were between 9–12 months old. |