
Fig. 3
- ID
- ZDB-FIG-180911-42
- Publication
- Oosterhof et al., 2018 - Colony-Stimulating Factor 1 Receptor (CSF1R) Regulates Microglia Density and Distribution, but Not Microglia Differentiation In Vivo
- Other Figures
- All Figure Page
- Back to All Figure Page
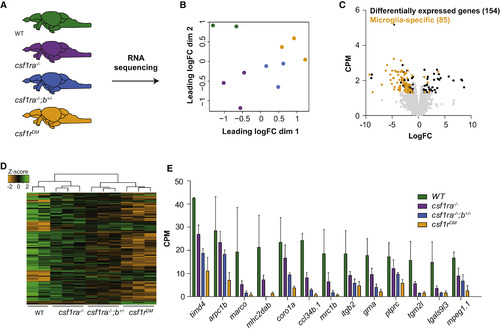
RNA Sequencing Reveals No Signs of Brain Pathology in csf1r Mutant Zebrafish (A) Schematic representation of the whole-brain RNA sequencing experiment. RNA was isolated from whole brains of WT, csf1ra−/−, csf1ra−/−;b+/−, and csf1rDM fish (3 brains per sample, 2–3 samples per genotype). (B) Multidimensional scaling plot. (C) Volcano plot with genes differentially expressed between csf1rDM and WT fish. Yellow dots represent genes that are part of the zebrafish microglia transcriptome (Oosterhof et al., 2017). Black dots represent the other differentially expressed genes. Gray dots represent all detected genes. (D) Heatmap with genes differentially expressed between csf1rDM and WT fish genes. (E) Expression values of differentially expressed microglia-specific genes. Genes were differentially expressed with false discovery rate (FDR) < 0.05 and log fold change (LogFC) > |1|. |