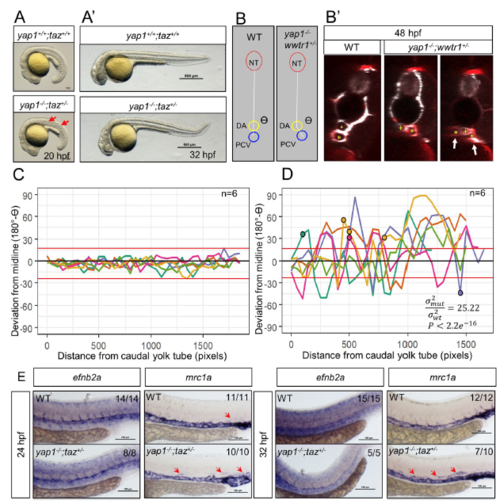
Yap1/Taz are required for PCV development. (A) Gross morphology of 20 hpf WT and yap1−/−;taz+/− embryos. Red arrows point to the undulating notochord. (A’) Gross morphology of 32 hpf WT and yap1−/−;taz+/− embryos. (B,B’) Transverse sections of the trunk revealing the relative positions of the neural tube (NT), dorsal aorta (DA) and posterior cardinal vein (PCV). The PCV of yap1−/−;taz+/− animals has deviated from the midline and appears to split into two lumenized vessels (arrows). White signal, etv2:EGFP transgene expression; red signal, lyve1b:DsRed transgene expression. The PVC lumen is marked with an asterisk (*), while the DA lumen is marked with a yellow “ + ”. (C,D) Analysis of the deviation of the PCV from the midline in 48 hpf embryos. The data are obtained from a series of transverse sections starting from the caudal end of the yolk tube and moving 50 sections rostrally. The NT, DA and PCV were manually demarcated and the deviation of the PCV from the midline was defined as β = 180°-ϴ. With ϴ (see panel B) we defined the angle formed by the NT, DA, and PCV in each transverse section. Each value of β was plotted for WT and yap1−/−;taz+/− trunks at 48 hpf. Each line represents a single animal. 4/6 of yap1−/−;taz+/− embryos exhibited a PCV that appears to split into two lumenized vessels that are lyve1b:DsRed positive (marked with a circle on the graph). Red horizontal lines above and below 0° are the WT maxima and minima. P values were calculated by the F-test, which tests whether the spread of angles (180° - ϴ) between WT and mutants is the same. σmut2: variance of (180° - ϴ) in yap1−/−;taz+/− animals; σWT2: variance of (180° - ϴ) in WT animals. (E) Whole mount in situ hybridization (WISH) for the expression of efnb2a and mrc1a, markers of arteries and veins, respectively. Red arrows point to expression of mrc1a in the region of the DA. The fraction of the embryos exhibiting the phenotype shown in each image was reported in the upper right corner of the corresponding panel. Scale bars, 100 μm.
|
