
Fig. 4
- ID
- ZDB-FIG-180508-16
- Publication
- Aguillon et al., 2018 - Cell-type heterogeneity in the early zebrafish olfactory epithelium is generated from progenitors within preplacodal ectoderm
- Other Figures
- All Figure Page
- Back to All Figure Page
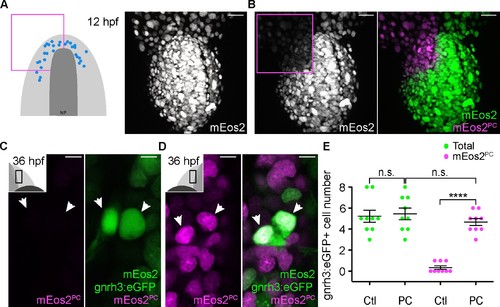
Lineage reconstruction reveals an anterior preplacodal ectoderm origin for Gnrh3 neurons: photoconversion. (A,B) Confocal projections of NLS-mEos2 loaded, Tg(gnrh3:eGFP) embryos at 12 hpf before (A) and after photoconversion (B). The first panel in (A) shows a schematic representation of the anterior neural plate (NP, dark grey) and adjacent preplacodal ectoderm (light grey) at 12 hpf indicating the origin of backtracked gnrh3:eGFP-positive cells (blue dots) and the photoconverted area (magenta square), which is also indicated on the confocal projection shown in (B) after photoconversion. Scalebars represent 30 μm. (C,D) Single confocal sections of olfactory epithelia from Tg(gnrh3:eGFP) embryos at 36 hpf showing the expression of eGFP from the transgene (cytoplasmic green), unconverted NLS-mEos2 (mEos2; nuclear green) and converted NLS-mEos2 (mEos2PC; nuclear magenta). Insets in (C) and (D) shows a schematic representation of an embryonic head at 36 hpf indicating the region analysed (black rectangle). Scalebars represent 5 μm. (E) Counts of cells expressing eGFP from the Tg(gnrh3:eGFP) transgene or eGFP and photoconverted mEos2 (mEos2PC) on the control (Ctl) versus photoconverted (PC) sides of the embryo at 36 hpf. No difference in the number of eGFP-positive cells is apparent between the Ctl and PC conditions (5.2 ± 0.6 versus 5.4 ± 0.5 cells per epithelium, n = 9 epithelia). Conversely, while a number of cells equivalent to the entire gnrh3:eGFP+ population is also mEos2PC-positive on the photoconverted side, virtually no eGFP/mEos2PC-double positive cells are detected on the control side (4.6 ± 0.3 versus 0.3 ± 0.2 cells per epithelium, n = 9 epithelia). Mean ±s.e.m. P values are calculated using a two-tailed Student's t-test, n.s. not significant, ****p<0.0001. |