
Fig. 3
- ID
- ZDB-FIG-180404-33
- Publication
- Gonzalez-Nunez, 2015 - Role of gabra2, GABAA receptor alpha-2 subunit, in CNS development.
- Other Figures
- All Figure Page
- Back to All Figure Page
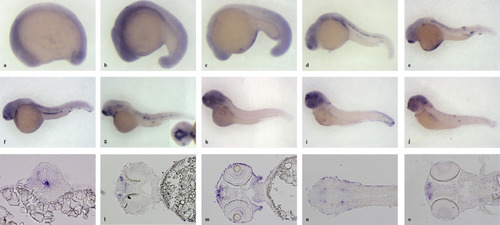
Developmental expression of gabra2 transcript. Analysis of dre-gabra2 expression by in situ hybridisation on wholemount embryos of (a) 11 somites, (b) 17 somites, (c) 20 hpf, (d) 24 hpf, (e) 30 hpf, (f) 36 hpf, (g) 42 hpf, (h) 48 hpf, (i) 3 dpf and (j) 4 dpf. (a–j) lateral views are shown, where embryos are oriented with the anterior towards the left. Inset of (g): ventral view of the head. (k–o) higher magnification images taken from 20 μm-thick sections that were obtained from stained embryos. (k) transverse section (oriented dorsal up) of a 24 hpf embryo at the level of the spinal cord, where intense labelling is seen at the floor plate of the neural tube. (l) coronal section (oriented anterior to the left) of an embryo of 48 hpf; staining is found lateral to the olfactory bulbs. (m and n) coronal sections (oriented anterior to the left) of embryos of 72 hpf, where gabra2 expressing cells are located at surroundings of the olfactory bulbs (m), in the ganglion cell layer of the retina (m) and in some nuclei of the thalamus and of the medulla oblongata (n). (o) coronal section (oriented anterior to the left) of an embryo of 4 dpf, where the olfactory epithelium is labelled with the gabra2 ISH probe. |
| Gene: | |
|---|---|
| Fish: | |
| Anatomical Terms: | |
| Stage Range: | 10-13 somites to Day 4 |