
Fig. 4
- ID
- ZDB-FIG-180125-14
- Publication
- Friedrich et al., 2017 - Multi-scale approaches for high-speed imaging and analysis of large neural populations
- Other Figures
- All Figure Page
- Back to All Figure Page
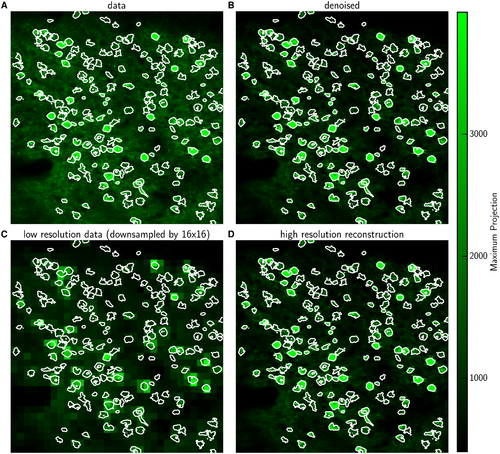
Previously identified shapes allow reconstruction at high spatial resolution based on low resolution imaging (best seen in S2 Video for full details). (A) Max projection image of the raw data Y with identified ROIs, i.e. neurons or activity hotspots. Contour lines contain 90% of the energy of each neural shape. (B) Max projection image of the denoised estimate A1 ⋅ C1 (plus the estimated background). (C) Max projection image for data obtained at lower spatial resolution, Yl; l = 16 here. (D) Reconstruction based on the low resolution data in (C) and previously identified shapes, A1 ⋅ Cl. The reconstruction looks very similar to the denoised high-resolution data of (B). Note: contours in (B-D) are not recomputed in each panel, but rather are copied from (A), to aid comparison. |