
FIGURE
Fig. 7
- ID
- ZDB-FIG-180125-15
- Publication
- Friedrich et al., 2017 - Multi-scale approaches for high-speed imaging and analysis of large neural populations
- Other Figures
- All Figure Page
- Back to All Figure Page
Fig. 7
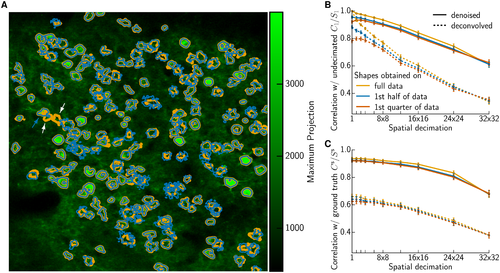
,p>Estimating neural shapes on small initial batch of the data. (A) Shapes inferred on the full data (orange) or using only the first half (blue). Two apparently lost suspected ROIs (white arrows) are actually part of another neuron (blue arrow) (B) Average correlation (±SEM) between traces Cl obtained on decimated data and the reference C1 obtained without any decimation. Similar results hold for median and IQR, but the resulting plot is too cluttered. (C) Comparing to simulated ground truth Cs. Traces were obtained on decimated data with reshuffled residuals, otherwise analogous to (B). |
Expression Data
Expression Detail
Antibody Labeling
Phenotype Data
Phenotype Detail
Acknowledgments
This image is the copyrighted work of the attributed author or publisher, and
ZFIN has permission only to display this image to its users.
Additional permissions should be obtained from the applicable author or publisher of the image.
Full text @ PLoS Comput. Biol.