
|
Fig. 4
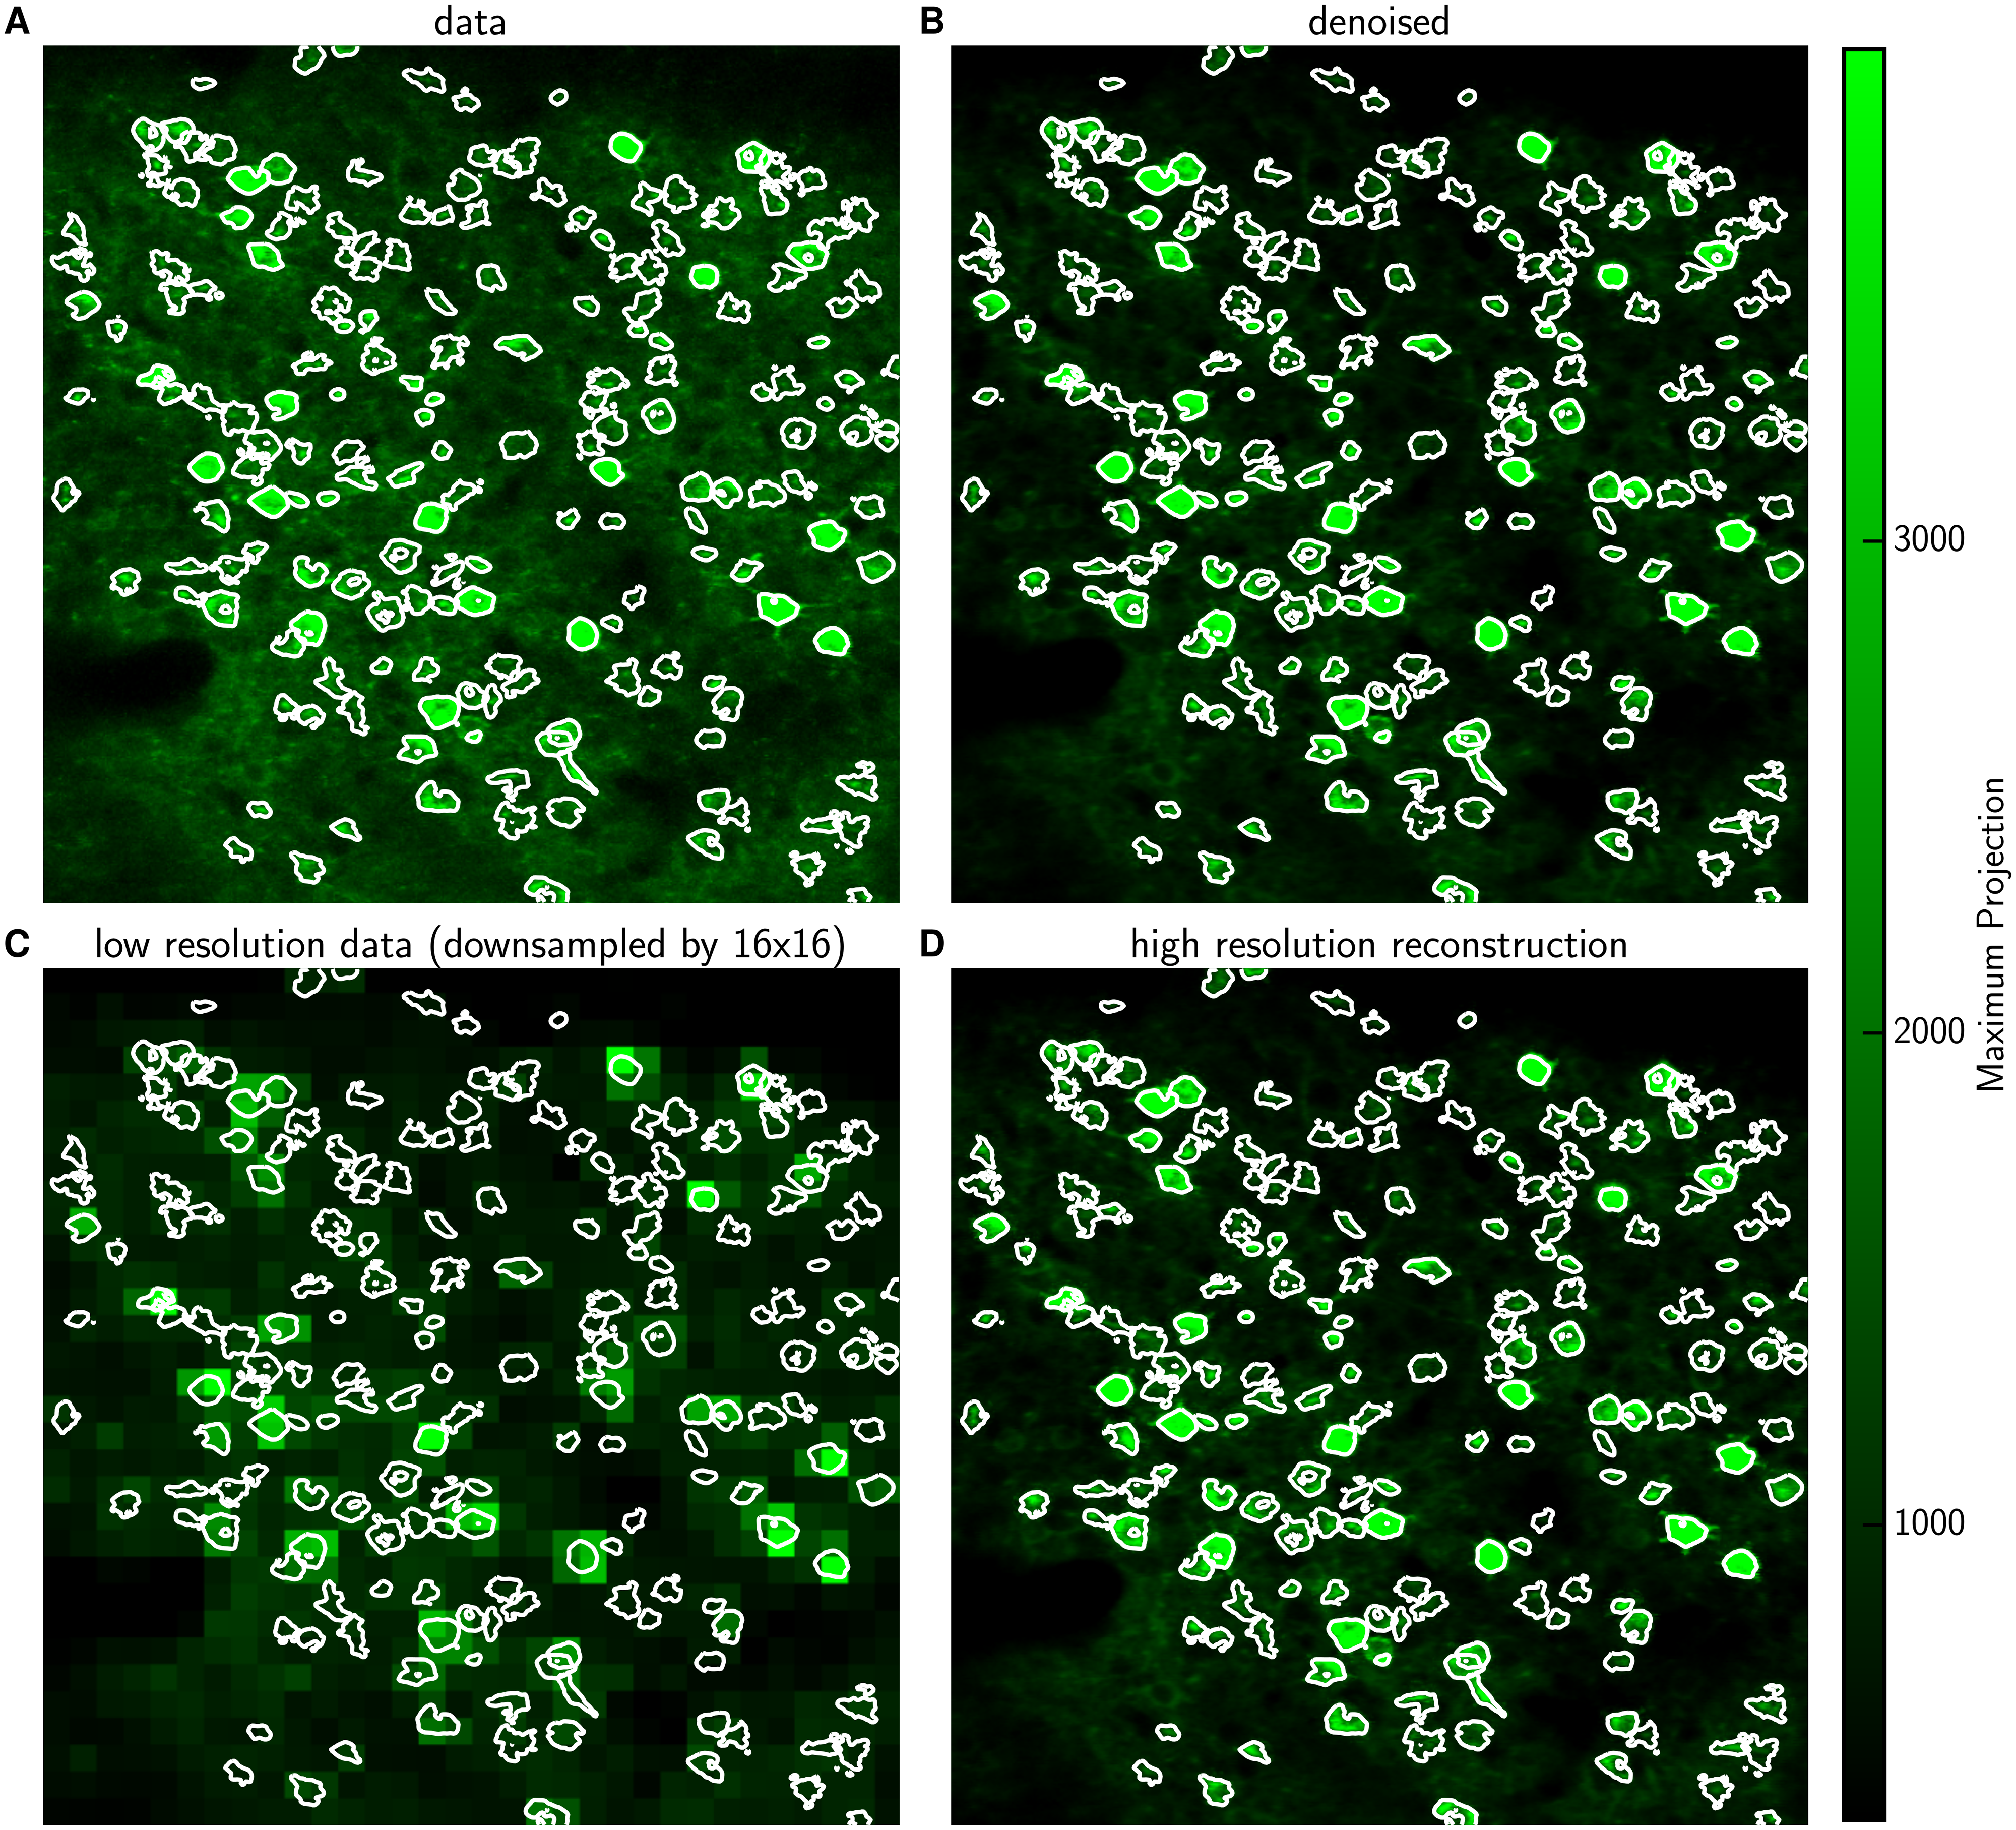
Previously identified shapes allow reconstruction at high spatial resolution based on low resolution imaging (best seen in S2 Video for full details).
(A) Max projection image of the raw data Y with identified ROIs, i.e. neurons or activity hotspots. Contour lines contain 90% of the energy of each neural shape. (B) Max projection image of the denoised estimate A1 ⋅ C1 (plus the estimated background). (C) Max projection image for data obtained at lower spatial resolution, Yl; l = 16 here. (D) Reconstruction based on the low resolution data in (C) and previously identified shapes, A1 ⋅ Cl. The reconstruction looks very similar to the denoised high-resolution data of (B). Note: contours in (B-D) are not recomputed in each panel, but rather are copied from (A), to aid comparison.