
Fig. S3
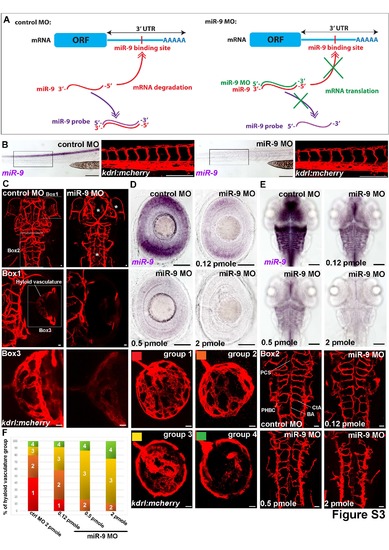
miR-9 controls the neurovasculature formation in a dose dependent manner (related to Figure 2) (A) Schematic representation of the miR-9 MO binding to microRNA-9. With the control MO, miR-9 is available, allowing the degradation of the mRNA target and revealing the miR-9 expression pattern with the specific miR-9 LNA probe. In presence of the miR-9 MO, miR-9 is bound by the MO, inhibiting the mRNA degradation and the binding of the LNA probe. (B) Whole-mount in situ hybridization against miR-9 at 72 hpf shows that miR-9 knockdown does not affect trunk morphogenesis.mCherry immunolabelling in Tg(kdrl:mCherry) at 72 hpf showing blood vessels formation in the trunk of control or miR-9 morphant larvae. In the trunk, miR-9 knockdown does not affect blood vessels development. (C) Confocal projections of mCherry immunolabelling in Tg(kdrl:mCherry) at 72 hpf showing blood vessels formation in control or miR-9 morphant larvae in the brain. The affected neurovasculature in the midbrain, hindbrain and retina is highlighted by an asterisk. (D, E) Whole-mount in situ hybridization against miR-9 at 72 hpf in larvae injected with the control MO or the miR-9 MO in the retina (D) and brain (E). Confocal projections of mCherry immunolabelling in Tg(kdrl:mCherry) at 72 hpf showing blood vessels formation in control MO and miR-9 MO injected larvae. Higher is the quantity of miR-9 MO injected in the egg, stronger is inhibition of miR-9 expression. The severity of the neurovasculature defects is correlated to the level of miR-9 inhibition. (F) The formation of the hyaloid vasculature in the retina of control MO (n=25) or miR-9 MO dilution series (n=24, 30 and 28 for croissant dilutions respectively) at 72 hpf was classified in four groups and quantified. Group 1: The blood vessels form a complex vascular network. Group 2: The hyaloid vasculature shows a reduced branching complexity. Group 3: In addition to the reduction of the branching, the caliber is affected and some vessels appear to be thicker. Group 4: The hyaloid vasculature is absent. Dorsal view of the brain with anterior up. Lateral view of the retina. Box1 is a close up of the retina. Box2 is a close up of the hindbrain. Box3 is a close up of the hyaloid vasculature in the retina. Scale bars: 10 μm for immunolabelling and 100 μm for whole mount ISH. |