
Fig. 4
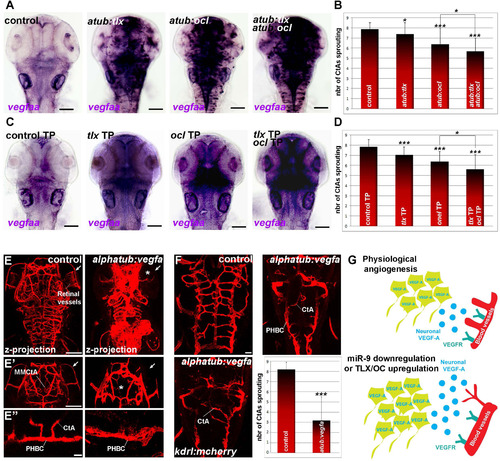
Tlx- and Oc-Dependent Neuronal Expression of VEGF-A Affect Brain Vasculature Development (A) Whole-mount in situ hybridization against vegfaa at 48 hpf in controls or embryos expressing uas:tlx, uas:ocl, or uas:tlx and uas:ocl in a pan-neuronal manner in Tg(alpha-tubulin:gal4). (B) Quantification of the number of CtAs found on each hemi-hindbrain in controls (n = 34) or larvae expressing uas:tlx (n = 46), uas:ocl (n = 46) or uas:tlx and uas:ocl (n = 46) in a pan-neuronal manner in Tg(alpha-tubulin:gal4) at 72 hpf. (C) Whole-mount in situ hybridization against vegfaa in embryos at 48 hpf injected with the control MO, tlx TP, ocl TP, or tlx and ocl TP. (D) Quantification of the number of CtAs found on each hemi-hindbrain in the control MO (n = 32), tlx TP (n = 34), ocl TP (n = 34), or tlx and ocl TP (n = 34) larvae at 72 hpf. (E) Neuronal expression of VEGF-A in the Tg(alpha-tubulin:gal4) line leads to a global increase in ECs and/or blood vessel formation in the brain at 72 hpf. While most of the vessels appear to be thicker, the mesencephalic central artery (MMCtA) and retinal blood vessels are reduced or missing (arrow and asterisk in E and E'). In the hindbrain, PHBCs are thicker, while CtA sprouting is reduced, suggesting that their development is affected following neuronal VEGF-A expression (E”). (F) Quantification of the number of CtAs found on each hemi-hindbrain in controls (n = 30) and larvae expressing vegfaa (n = 20) in neurons at 72 hpf. (G) During the normal development of the neurovascular system, miR-9 represses the expression of Tlx and Oc to limit the level of neuronally derived VEGF-A. A reduction of miR-9 expression and/or an overexpression of Tlx/Oc increases the level of neuronal VEGF-A and affects the development of the brain vasculature. Dorsal view of the brain with anterior up. Scale bars: 100 μm in (A), (C), (E), and (E') or 10 μm in (F) and (E”). Error bars represent SD. ∗p < 0.05; ∗∗∗p < 0.0005, determined by t test, two-tailed. |