
Fig. 5
- ID
- ZDB-FIG-170725-10
- Publication
- Ferre-Fernández et al., 2017 - Whole-Exome Sequencing of Congenital Glaucoma Patients Reveals Hypermorphic Variants in GPATCH3, a New Gene Involved in Ocular and Craniofacial Development
- Other Figures
- All Figure Page
- Back to All Figure Page
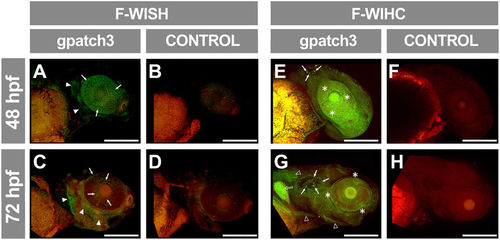
Analysis of gpatch3 expression in ocular and non-ocular embryonic tissues during early zebrafish development. (A–D) Expression analysis by fluorescent-whole mount in situ hybridization (F-WISH) of gpatch3 in zebrafish embryos at 48 (A and B) or 72 (C and D) hpf with Alexa Fluor-488 labelled gpatch3 antisense RNA probes (A and C) or sense RNA probes as a control (B and D). The green channel corresponds to gpatch3 expression and the red channel to tissue autofluorescence. The arrows and arrowheads indicate gpatch3 expression in the developing anterior segment and head dermis, respectively. Scale bars represent 200 μm. (E–H) Immunodetection by fluorescent-whole mount immunohistochemistry (F-WIHC) of Gpatch3 in zebrafish embryos at 48 (E and F) or 72 hpf (G and H) using rabbit anti-GPATCH3 primary antibody and Cy2 donkey anti-rabbit secondary antibody (E and G) or only secondary antibody (F and H) as a negative control. The green channel corresponds to Gpatch3 expression and the red channel to tissue autofluorescence. Arrows, empty arrowheads, empty arrow and asterisks indicate Gpatch3 expression in the otic vesicle, muscles, pectoral fin and developing anterior segment, respectively. Scale bars represent 200 μm. |
| Gene: | |
|---|---|
| Antibody: | |
| Fish: | |
| Anatomical Terms: | |
| Stage Range: | Long-pec to Protruding-mouth |