
Fig. 4
- ID
- ZDB-FIG-170620-1
- Publication
- Maskell et al., 2017 - Essential but partially redundant roles for POU4F1/Brn-3a and POU4F2/Brn-3b transcription factors in the developing heart
- Other Figures
- All Figure Page
- Back to All Figure Page
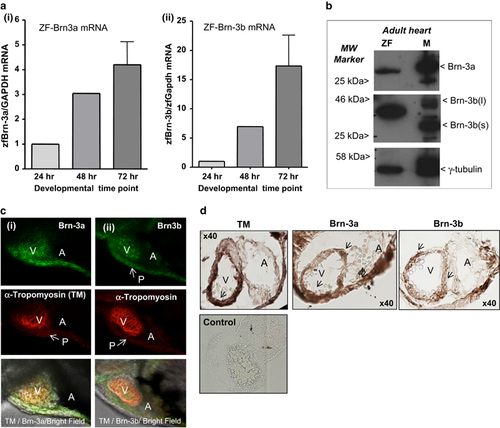
(a) Results of qRT-PCR showing (i) Brn-3a and (ii) Brn-3b mRNA levels in the developing zebrafish at 24, 48 and 72 hpf. cDNA from total RNA was amplified using primers to ZF Brn-3a and Brn-3b and a variation in mRNA levels was corrected using ZF GAPDH. Values were expressed as fold induction relative to expression at 24 h (set at 1). (b) Representative western blot analysis showing single protein band for both Brn-3a and Brn-3b in extracts from adult ZF compared with adult mouse heart (M), used as a positive control. MW markers indicate the protein size and gamma (γ) tubulin was used to control for variation in total protein. (c) Representative images showing whole-mount immunostaining for (i) Brn-3a or (ii) Brn-3b (green; top panels) in ZF hearts at 72 hpf. Co-staining with tropomyosin (red; middle panels) indicate cardiomyocytes in the developing heart. Lower panel shows merge with bright field image. V, A, P (indicated by arrow). (d) Representative images of DAB-immunostained ZF embryos sections at 72 hpf. Protein localisation is seen as dark brown staining in ventricles (indicated by arrow), identified by TM, also shows Brn-3a and Brn-3b expression. × 40 magnification. A, atria; hpf, hours post fertilisation; MW, molecular weight; P, pericardial sac; TM, tropomyosin; V, ventricle; ZF, zebrafish heart |
| Genes: | |
|---|---|
| Antibodies: | |
| Fish: | |
| Anatomical Terms: | |
| Stage Range: | Prim-5 to Adult |