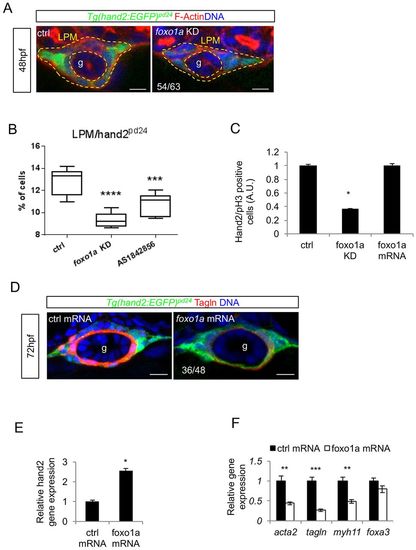
Foxo1a is required for LPM commitment to iSMC differentiation. (A) foxo1a knockdown reduces the number of LPM cells without affecting migration. Confocal transverse sections of the gut (g) in Tg(hand2:EGFP)pd24 embryos injected with foxo1a morpholino and stained for phalloidin (red) at 48 hpf. The number of embryos showing fewer LPM cells is indicated. Nuclei are in blue. Scale bars: 15 μm. (B) Pharmacological and genetic foxo1a inhibition affect LPM. Box and whisker plots show the percentage of LPM cells isolated by fluorescent-activated cell sorting (FACS) experiments from trunks of Tg(hand2:EGFP)pd24 embryos 48 hpf after chemical (AS1842856) or genetic (foxo1a knockdown) foxo1a blockage. The boxplots show the maximum, minimum, upper and lower quartiles, and the sample median. Asterisks represent the results of one-way ANOVA-Dunnett's post-hoc test (***P<0.001, ****P<0.001; from left to right: n=12, n=6 and n=9 groups of 10-20 embryos). (C) foxo1a knockdown impaired LPM proliferation. The histogram shows the normalized count of pH3-positive cells in the LPM of Tg(hand2:EGFP)pd24 embryos at 48 hpf after foxo1a knockdown or overexpression (*P<0.05). (D) foxo1a mRNA overexpression blocks iSMC differentiation. Confocal transverse sections of Tg(hand2:EGFP)pd24 embryos at 72 hpf overexpressing foxo1a mRNA and stained for Tagln (red). The number of embryos exhibiting the phenotype is indicated. Nuclei are in blue. Scale bars: 15 μm. (E) foxo1a mRNA overexpression increases hand2 expression. Histograms show hand2 mRNA levels measured by qRT-PCR in foxo1a-overexpressing embryos compared with controls at 48 hpf (*P<0.05). (F) foxo1a mRNA overexpression affect iSMC marker expression. Histograms show acta2, tagln, myh11 and foxa3 mRNA levels measured by qRT-PCR in foxo1a-overexpressing embryos compared with controls at 72 hpf. The expression of endodermal marker foxa3 is not altered (**P<0.01, ***P<0.001).
|
