
Fig. 3
- ID
- ZDB-FIG-161222-10
- Publication
- Eum et al., 2016 - 3D Visualization of Developmental Toxicity of 2,4,6-Trinitrotoluene in Zebrafish Embryogenesis Using Light-Sheet Microscopy
- Other Figures
- All Figure Page
- Back to All Figure Page
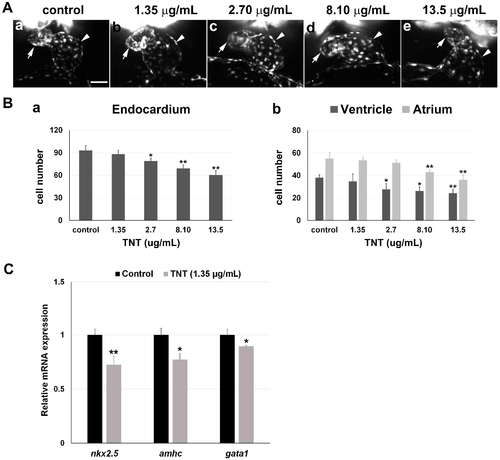
3D light-sheet imaging/SPIM (Single Plane Illumination Microscopy) of TNT cardiac toxicity. (A) TNT in pink water caused abnormal cardiac looping in a dose-dependent manner. (a–e) Endocardiums were visualized by SPIM in 38 hpf Tg(fli1a:EGFP) embryos treated with pink water containing TNT at 0 (a, control), 1.35 (b), 2.70 (c), 8.10 (d) and 13.5 µg/mL (e) from 5 hpf (2 experiments, n = 5 for each treatment). Live 3D reconstructions of the hearts were generated using Arivis software. Arrow, atrium; arrowhead, ventricle. 10× water lens, scale bar 50 µm. 3D reconstruction of each heart imaging is individually shown in Supplementary video 1A–E, respectfully; (B) (a) Treatment with pink water significantly reduced endocardial cell number in a dose-dependent manner; (b) The endocardium in the atrium was affected by TNT toxicity to a greater extent than the endocardium in the ventricle. * p < 0.05, ** p < 0.001; (C) Quantitative real time PCR (qPCR) analysis to measure mRNA expression of two heart-specific genes, nkx2.5 and amhc, and a blood specific gene, gata1, in the embryos treated with 0 and 1.35 µg/mL TNT from 5 till 36 hpf. Data are the mean ± SEM of three independent samples, differences between the means were evaluated with an independent-samples t-test. * p = 0.001, ** p < 0.0005. |