
Fig. 7
- ID
- ZDB-FIG-160526-8
- Publication
- Filosa et al., 2016 - Feeding State Modulates Behavioral Choice and Processing of Prey Stimuli in the Zebrafish Tectum
- Other Figures
- All Figure Page
- Back to All Figure Page
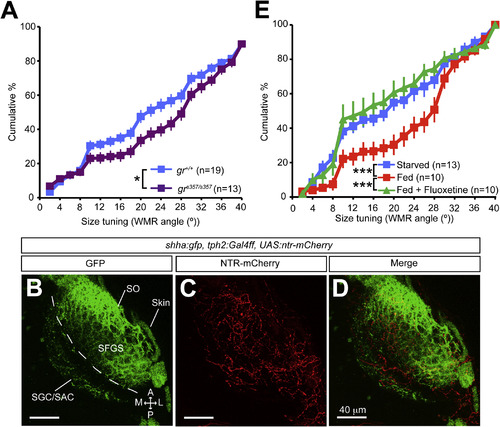
The HPI Axis and the Serotonergic System Modulate Visual Information Processing in the Tectum (A) Graph depicting cumulative percentages of WMR angles for PVNs in starved 7 dpf elavl3:Gal4, UAS:GCaMP5, grs357/s357 and starved control elavl3:Gal4, UAS:GCaMP5, gr+/+ larvae. p = 0.02, two-sample Kolmogorov-Smirnov test. (B-D) Confocal images of a 7 dpf shha:gfp, tph2:Gal4ff, UAS:ntr-mCherry larva showing the presence of serotonergic innervation (red neurites in C and D) in the tectum neuropil (GFP-positive RGC axons in B and D). A, anterior; L, lateral; M: medial; NTR, nitroreductase; P, posterior; SAC, stratum album centrale; SFGS, stratum fibrosum et griseum superficiale; SGC, stratum griseum centrale; SO, stratum opticum. (E) Graph comparing average cumulative percentages of WMR angles for PVNs of fed elavl3:Gal4, UAS:GCaMP5 larvae treated with 1.5 µM fluoxetine and untreated fed or starved controls. Fluoxetine abolished the satiety-induced change of PVN population response. ***p < 0.001, two-sample Kolmogorov-Smirnov tests. Data are presented as mean ± SEM. |