
Fig. 3
- ID
- ZDB-FIG-160526-4
- Publication
- Filosa et al., 2016 - Feeding State Modulates Behavioral Choice and Processing of Prey Stimuli in the Zebrafish Tectum
- Other Figures
- All Figure Page
- Back to All Figure Page
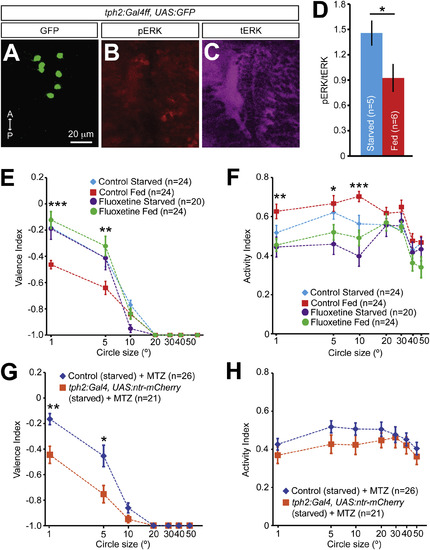
Serotonin Modulates Behavioral Choice Downstream of Feeding State (A-C) Confocal images of a 7 dpf tph2:Gal4ff, UAS:GFP larva showing serotonergic neurons in the raphe nucleus (A), and immunofluorescence detection of phosphorylated ERK (pERK, B) and total ERK (tERK, C). A, anterior; P, posterior. (D) Plot showing average pERK/tERK staining intensity ratios in raphe serotonergic neurons of 7 dpf fed or starved larvae. *p = 0.04, t test. (E and F) Plots showing valence (E) and activity (F) indices of starved and fed larvae, treated with 1.5 µM fluoxetine, and untreated controls. *p < 0.05; **p < 0.01; p < ***0.001, t test with Benjamini-Hochberg correction. Asterisks indicate statistical significance only for the control fed and fluoxetine fed comparison. Statistical results are summarized in Table S2. (G and H) Graphs depicting valence (G) and activity (H) indices for fish lacking serotonergic neurons, and control larvae. *p < 0.05; **p < 0.01, t test with Benjamini-Hochberg correction. Data are presented as mean ± SEM. See also Table S2. |