
Fig. 2
- ID
- ZDB-FIG-160303-16
- Publication
- Bensimon-Brito et al., 2016 - Revisiting in vivo staining with alizarin red S - a valuable approach to analyse zebrafish skeletal mineralization during development and regeneration
- Other Figures
- All Figure Page
- Back to All Figure Page
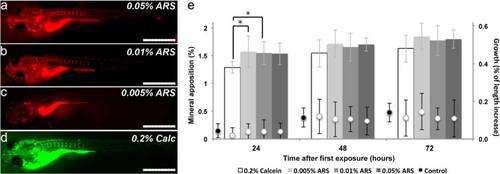
Determination of the proper ARS concentration for vital staining. Imaging of 6 dpf stained larvae with the same settings showed that (a) 0.05 % ARS 15 min immersion yielded stronger staining than (b) 0.01 % ARS, but the later provided the best signal to noise ratio, with minimum stress levels. c 0.005 % ARS was considered the lowest concentration providing signal detection, since most structures were weakly stained. d 0.2 % calcein staining was used as a reference staining. e Graphical representation of mineral apposition rates (columns) at 24, 48 and 72 h after first staining, when exposed to 0.005, 0.01 and 0.05 % ARS and 0.2 % calcein. Bars represent standard deviation. Means were statistically different (*p < 0.05), by multiple comparison of means using one-way ANOVA and Tukey’s post test, between larvae stained with calcein and those stained with 0.005 % (0.29 % less apposition rate with calcein, 82 % of the 0.005 % ARS value) and 0.01 % (0.26 % less mineral apposition rate with calcein, 83 % of the 0.01 % ARS value) ARS at 24 hps. On the second axis of the graph, growth (inferred by increase in TL) is indicated: control conditions (black dots; n = 17); following staining with 0.005, 0.01 and 0.05 % ARS, and 0.2 % calcein (white dots; n = 17). Scale bars = 1 mm |