
Fig. 3
- ID
- ZDB-FIG-151229-16
- Publication
- Ariotti et al., 2015 - Modular Detection of GFP-Labeled Proteins for Rapid Screening by Electron Microscopy in Cells and Organisms
- Other Figures
- All Figure Page
- Back to All Figure Page
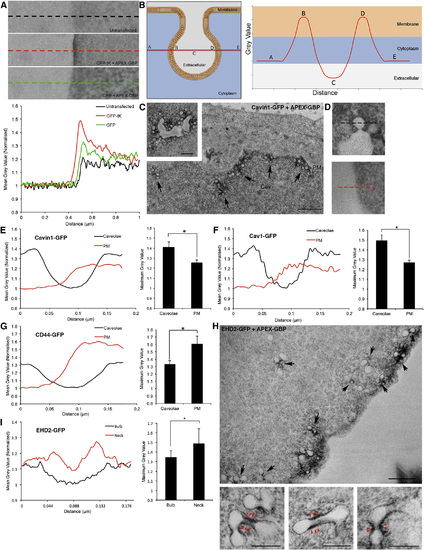
Quantitative Assessment of Caveolar Coat Protein Enrichment at Caveolae Compared to the Bulk Plasma Membrane (A) Top: linescan from extracellular to intracellular regions were taken perpendicular to the PM and demonstrate the quantitative contrast differences between untransfected cells, GFP-tK + APEX-GBP and GFP + APEX-GBP. Bottom: the profiles of the linescan indicate density enrichment at the PM to cells expressing GFP-tK and the cytoplasm in cell expressing GFP. (B) Graphical schematic of linescans performed across caveolae at the region of the caveolar bulb with greatest diameter such that the membrane is spanned twice and parallel to the bulk plasma membrane. (C) APEX-GBP mediated localization of Cavin1-GFP to caveolae at the PM of BHK cells. Arrows indicate caveolae at the PM positive for Cavin1-GFP and APEX-GBP. Cav, caveolae. Scale bar represents 500 nm; inset, 200 nm. (D) Top: high-magnification image of a linescan performed across caveolae positive for Cavin1-GFP and APEX-GBP. Bottom: high-magnification image of a linescan perpendicular to the PM from the same cell. (E) Left: quantification comparing average gray values between bulk PM and caveolae from six different regions of the same cell expressing Cavin1-GFP + APEX-GBP to gain an average value. Multiple cells were quantified from multiple independent repeats (n = 4). Right: quantification of average maximum gray values. Statistical significance was determined using two-tailed t tests (p = 0.045); error bars represent SEM. (F and G) Caveolin-1-GFP (Cav1) + APEX-GBP (p = 0.014) demonstrated a similar enrichment of electron density at the sites of caveolae compared to the bulk PM however CD44-GFP + APEX-GBP (p = 0.05) was significantly enriched at the PM and excluded from caveolae. (H) EHD2-GFP is enriched at caveolae on the PM; however, the electron density generated by the DAB reaction and APEX-GBP binding suggests EHD2 is excluded from the caveolar bulb and specifically enriched at the neck of caveolae. Black arrows highlight caveolae with enriched electron density at the neck of caveolae and red arrowheads denote enriched electron density at the caveola neck at higher magnification. Scale bars at lower magnification represent 500 nm. Scale bars for insets represent 200 nm. (I) Left: quantitative linescans comparing average gray values between the caveolar bulb and the caveolar neck region in cells expressing EHD2-GFP (n = 3). Bottom right: quantification of average maximum gray values. Statistical significance was determined using two tailed t tests (p = 0.0083); error bars represent the SD of the mean. |
Reprinted from Developmental Cell, 35(4), Ariotti, N., Hall, T.E., Rae, J., Ferguson, C., McMahon, K.A., Martel, N., Webb, R.E., Webb, R.I., Teasdale, R.D., Parton, R.G., Modular Detection of GFP-Labeled Proteins for Rapid Screening by Electron Microscopy in Cells and Organisms, 513-25, Copyright (2015) with permission from Elsevier. Full text @ Dev. Cell