
Fig. 3
- ID
- ZDB-FIG-150430-19
- Publication
- Hui et al., 2014 - Genome wide expression profiling during spinal cord regeneration identifies comprehensive cellular responses in zebrafish
- Other Figures
- All Figure Page
- Back to All Figure Page
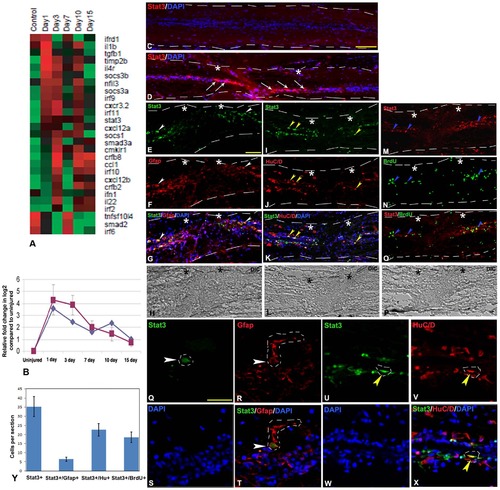
Differentially expressed genes related to inflammatory response and validation of stat3 expression in uninjured and injured zebrafish spinal cord. A) Dendrogram representing genes related to regulation of inflammation. Each horizontal line indicates the expression pattern of each gene and the vertical columns indicate the uninjured control and time points after SCI. The color chart indicates mean fold change of gene expression in each time points. Red and green colors represent increased and decreased expression respectively. B) Quantitative RT-PCR of stat3 expression showing fold change (red graph) and pattern of expression at different time points after injury. The temporal expression pattern of qRT-PCR (red graph) was compared with results of microarray analysis (blue graph). Error bars represent SEM, n = 3, p<0.01. C) A longitudinal section of uninjured cord stained with STAT3 and DAPI. D) A longitudinal section of 1 dpi cord showing many STAT3 positive cells (white arrows) close to the injury epicenter (double white stars) counter stained with DAPI. E–H) A longitudinal section of 3 dpi cord double stained with STAT3 and radial glial marker- GFAP, showing individual panels of STAT3 (E), GFAP (F), merge with DAPI (G) and DIC (Differential interference contrast) (H). A few STAT3+ cells are colocalized with GFAP+ cells (white arrowheads) close to injury epicenter. I–L) A longitudinal section of 3 dpi cord showing colocalization of STAT3 and newly formed neuronal marker, HuC/D with individual panels of STAT3 (I), HuC/D (J), merge with DAPI (K) and DIC (L). Some of the STAT3+ cells are colocalized with HuC/D+ cells (yellow arrowheads) close to the injury epicenter. M–P) A longitudinal section of 3 dpi cord colocalized with STAT3 and proliferating cell marker, BrdU shows individual panels of STAT3 (M), BrdU (N), merge (O) and DIC (P). Proliferating BrdU+ cells are also colocalized with STAT3+ cells (blue arrowheads) close to the injury epicenter. White dashed line in panel C to P mark the boundary of spinal cord tissue. Q–T) A representative higher magnification of 3 dpi cord section shows individual panels like STAT3 (Q), GFAP (R), DAPI (S) and merge (T). A STAT3+ cell (white arrowhead; the boundary of the cell nucleus is markedby white dashed line) is colocalized with GFAP+ radial glia (white arrowhead; the boundary of the cytoplasm of radial glia is marked by white dashed line). U–X) A representative higher magnification of 3 dpi cord section shows individual panels like STAT3 (U), HuC/D (V), DAPI (W) and merge (X). A STAT3+ cell (yellow arrowhead; the boundary of the cell nucleus is marked by white dashed line) is colocalized with HuC/D+ newly formed neuron close to ependyma (yellow arrowhead; the boundary of the cell nucleus is marked by white dashed line). Y) Quantitative analysis of STAT3+, STAT3+/GFAP+, STAT3+/HuC/D+ and STAT3+/BrdU+ cells in 3 dpi cord in longitudinal sections. The value represented as Mean±SEM of individual longitudinal section, n = 5 cord, p<0.01.Scale bar = 200 µm (C–D); 50 µm (E–P), 20 µm (Q–X). |
| Genes: | |
|---|---|
| Antibody: | |
| Fish: | |
| Condition: | |
| Anatomical Terms: | |
| Stage Range: | Days 30-44 to Adult |
| Fish: | |
|---|---|
| Condition: | |
| Observed In: | |
| Stage Range: | Days 30-44 to Adult |