
Fig. 6
- ID
- ZDB-FIG-150121-17
- Publication
- Wanglar et al., 2014 - Tbx Protein Level Critical for Clock-Mediated Somite Positioning Is Regulated through Interaction between Tbx and Ripply
- Other Figures
- All Figure Page
- Back to All Figure Page
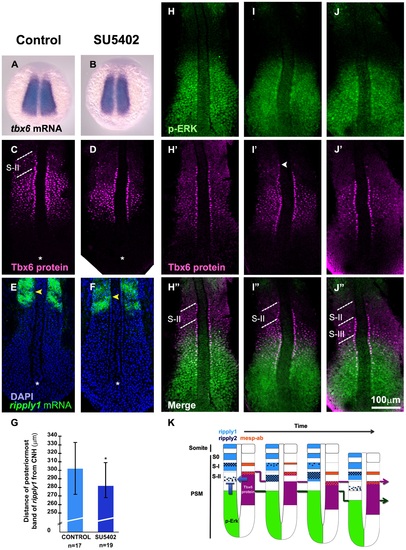
FGF signaling is required for ripply suppression. (A-F) Effect of SU5402, a chemical inhibitor against FGF signaling, on tbx6 mRNA (A, B), Tbx6 protein (C, D) and ripply1 mRNA (E, F) patterns in embryos at the 8 somite stage. Control embryos treated with DMSO (A, C, E) and embryos treated with SU5402 (B, D, F) are shown. While tbx6 mRNA expression was unchanged (A, B), the anterior border of the Tbx6 domain was moved posteriorly in SU5402 treated embryos when compared with control embryos at the same phase of the segmentation cycle (C, D). Note that both of these embryos are at the stage when Tbx6 proteins just started to be eliminated in the anterior domain. A total of 15 number set of embryos were observed each for A and B, and all of the treated embryos did not show any change in tbx6 mRNA expression pattern when compared to control embryos. Another 32 number set of embryos were treated with SU5402 and examined for Tbx6 protein, where, about 87% of the embryos showed posterior shift of anterior domain of Tbx6 protein when compared to control embryos. (E, F) ripply1 expression is initiated earlier (yellow arrowheads) in SU5402 treated embryos (F) when compared to control ones (E) at the same phase of the segmentation cycle. Asterisk indicates the position of the chordo neural hinge (CNH). (G) The distance of the anterior border of the posteriormost expression of ripply1 from the CNH in SU5402 treated embryos was significantly shorter than the control embryos; * p<0.05 (n = 17 for control embryos and n = 19 for SU5402 treated embryos). Error bars indicate standard deviation. (H-J) Spatial distribution of FGF signaling was examined during a segmentation cycle in comparison with Tbx6 protein domain at the 8 somite stage. FGF signaling was monitored by staining with anti-phosphorylated Erk antibody. The upper band is indicated by an arrowhead in white. (K) A schematic representation of spatial patterns of Tbx6 and p-Erk domains with ripply1, ripply2, and mesp-ab expressions during single segmentation cycle. Expression of ripply1 and ripply2 is initially activated in the high Tbx6/low FGF signaling region. These activated Ripplys appear to suppress Tbx6 protein resulting in formation of a new anterior border of the Tbx6 core domain and the upper band. Then, expansion of ripply expression domain causes elimination of the upper band of Tbx6 protein. On the other hand, mesp-ab expression is activated at the anterior border of the Tbx6 domain, and remained at the same position. The dotted lines indicate S-II (C, H′′, I′′) and, S-II and S-III (J′′) regions. |
| Genes: | |
|---|---|
| Antibody: | |
| Fish: | |
| Condition: | |
| Anatomical Term: | |
| Stage: | 5-9 somites |