
Fig. S1
- ID
- ZDB-FIG-141124-14
- Publication
- Tsuji et al., 2014 - Whole Organism High Content Screening Identifies Stimulators of Pancreatic Beta-Cell Proliferation
- Other Figures
- All Figure Page
- Back to All Figure Page
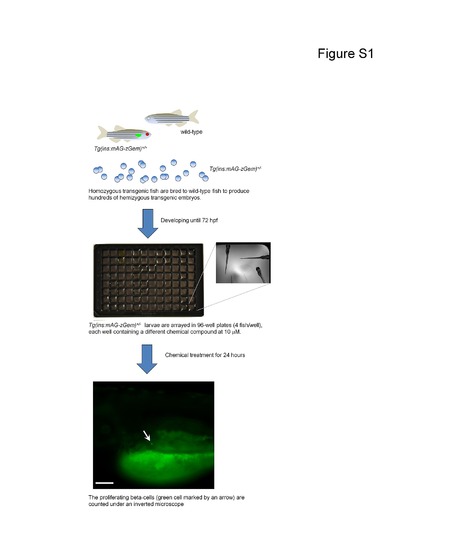
Schematic outline of the screening protocol used to identify compounds that promote beta-cell proliferation. The images show typical examples from the screen. Tg(ins:mAG-zGeminin(1/100))s947 larvae were arrayed in 96-well plates and exposed to 10 μM of a compound in 1% DMSO from 3 to 4 dpf (i.e., when most beta-cells are in a resting phase (Fig. 1F)). Larvae were incubated in 1% DMSO as a negative control. Tg(ins:mAG-zGeminin(1/100))s947+ beta-cells in 4 dpf anesthetized larvae were counted by eye under an inverted fluorescence microscope. Beta-cell proliferation can be easily quantified because mAG-zGeminin(1/100) labels the nuclei of proliferating beta-cells with bright fluorescence. Fluorescent image at the bottom panel is a lateral view, anterior to the left and dorsal to the top (Scale bar = 100 μm). |