
Fig. 1
- ID
- ZDB-FIG-141124-9
- Publication
- Tsuji et al., 2014 - Whole Organism High Content Screening Identifies Stimulators of Pancreatic Beta-Cell Proliferation
- Other Figures
- All Figure Page
- Back to All Figure Page
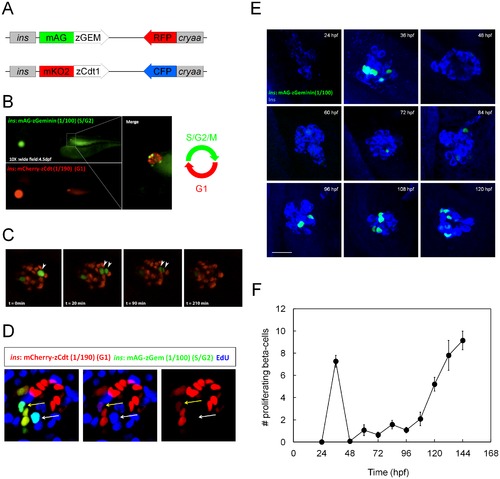
Development and characterization of fluorescent ubiquitylation-based cell cycle indicator (FUCCI) for pancreatic beta-cells in zebrafish. (A) Schematic diagrams of FUCCI constructs for pancreatic beta-cells. The S/G2/M reporter mAG-zGeminin(1/100) and the G1 indicator mKO2-zCdt1(1/190) are expressed under the zebrafish insulin promoter. For efficient selection of transgenic animals, an eye-marker cassette, cryaa:RFP or cryaa:CFP, was introduced into Tg(ins:mAG-zGeminin(1/100)) and Tg(ins:mCherry-zCdt1(1/190)), respectively [8]. (B) Tg(ins:mCherry-zCdt1(1/190),cryaa:CFP)s948;Tg(ins:mAG-zGeminin(1/100),cryaa:RFP)s947 larvae were examined at 4.5 dpf using fluorescence microscopy. A close up of the islet is shown in the inset. A majority of the beta-cells are Tg(ins:mCherry-zCdt1(1/190))+ indicating that they are in the G1 phase of the cell cycle. Only four beta-cells are Tg(ins:mAG-zGeminin(1/100))s947 + indicating that they are in the S/G2/M phase of the cell cycle. Note that the animals are expressing the eye-marker, e.g., cryaa:CFP fluorescence can be observed through the GFP filter. (C) Time-lapse imaging of Tg(ins:mCherry-zCdt1(1/190))s948;Tg(ins:mAG-zGeminin(1/100))s947 larvae at 4 dpf. Arrowheads point to dividing Tg(ins:mAG-zGeminin(1/100))s947 + beta-cells. (D) Tg(ins:mCherry-zCdt1(1/190))s948;Tg(ins:mAG-zGeminin(1/100))s947 larvae were incubated with EdU from 3 to 4 dpf. The white arrow points to a Tg(ins:mAG-zGeminin(1/100))s947+ single-positive beta-cell. This cell exhibits high levels of EdU incorporation. The yellow arrow points to a Tg(ins:mCherry-zCdt1(1/190))s948;Tg(ins:mAG-zGeminin(1/100))s947 double positive beta-cell which exhibits low levels of EdU incorporation indicating that this cell entered S phase at the end of the EdU labeling period. (E) Confocal stacks of Tg(ins:mAG-zGeminin(1/100))s947 + (green) beta-cells stained for Insulin (blue). The animals were fixed at 12 h intervals until 5 dpf. (Scale bar = 20 μm.). (F) The graph shows a quantification of the number of Tg(ins:mAG-zGeminin(1/100))s947 + beta-cells. Error bars represent SEM; n = 13–15 larvae for each time point. B is a lateral view, anterior to the left and dorsal to the top. C–E show lateral views, anterior to the top and dorsal to the left. |
| Genes: | |
|---|---|
| Antibody: | |
| Fish: | |
| Anatomical Term: | |
| Stage Range: | Prim-5 to Day 5 |