
Fig. 4
- ID
- ZDB-FIG-141124-12
- Publication
- Tsuji et al., 2014 - Whole Organism High Content Screening Identifies Stimulators of Pancreatic Beta-Cell Proliferation
- Other Figures
- All Figure Page
- Back to All Figure Page
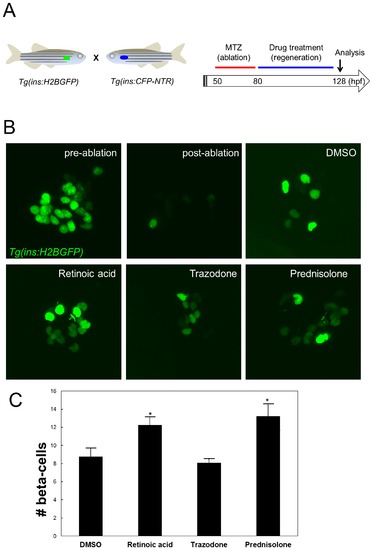
RA and Prednisolone but not Trazodone, enhance beta-cell regeneration. (A) Schematic diagram for assessment of beta-cell regeneration. To examine beta-cell regeneration, we made use of the NTR/MTZ beta-cell ablation model. At 80 hpf, after ablating the beta-cells with MTZ from 50–80 hpf, Tg(ins:H2BGFP);Tg(ins:CFP-NTR) larvae were treated with the compounds for 48 h. The numbers of Tg(ins:H2BGFP)+ cells were counted at 128 hpf. (B) Confocal images of Tg(ins:H2BGFP)+ beta-cells in larvae treated with 1 μM retinoic acid, 10 μM trazodone, or 10 μM prednisolone in 1% DMSO at 128 hpf. Each image is a lateral view, anterior to the bottom and dorsal to the right. (C) Quantification of beta-cell regeneration per larva at 128 hpf, following treatment with hit compounds from 80–128 hpf. Error bars represent SEM. *P<0.05 compared to DMSO treated controls; n = 13–16 larvae for each group. |
| Fish: | |
|---|---|
| Conditions: | |
| Observed In: | |
| Stage: | Day 5 |